|
|
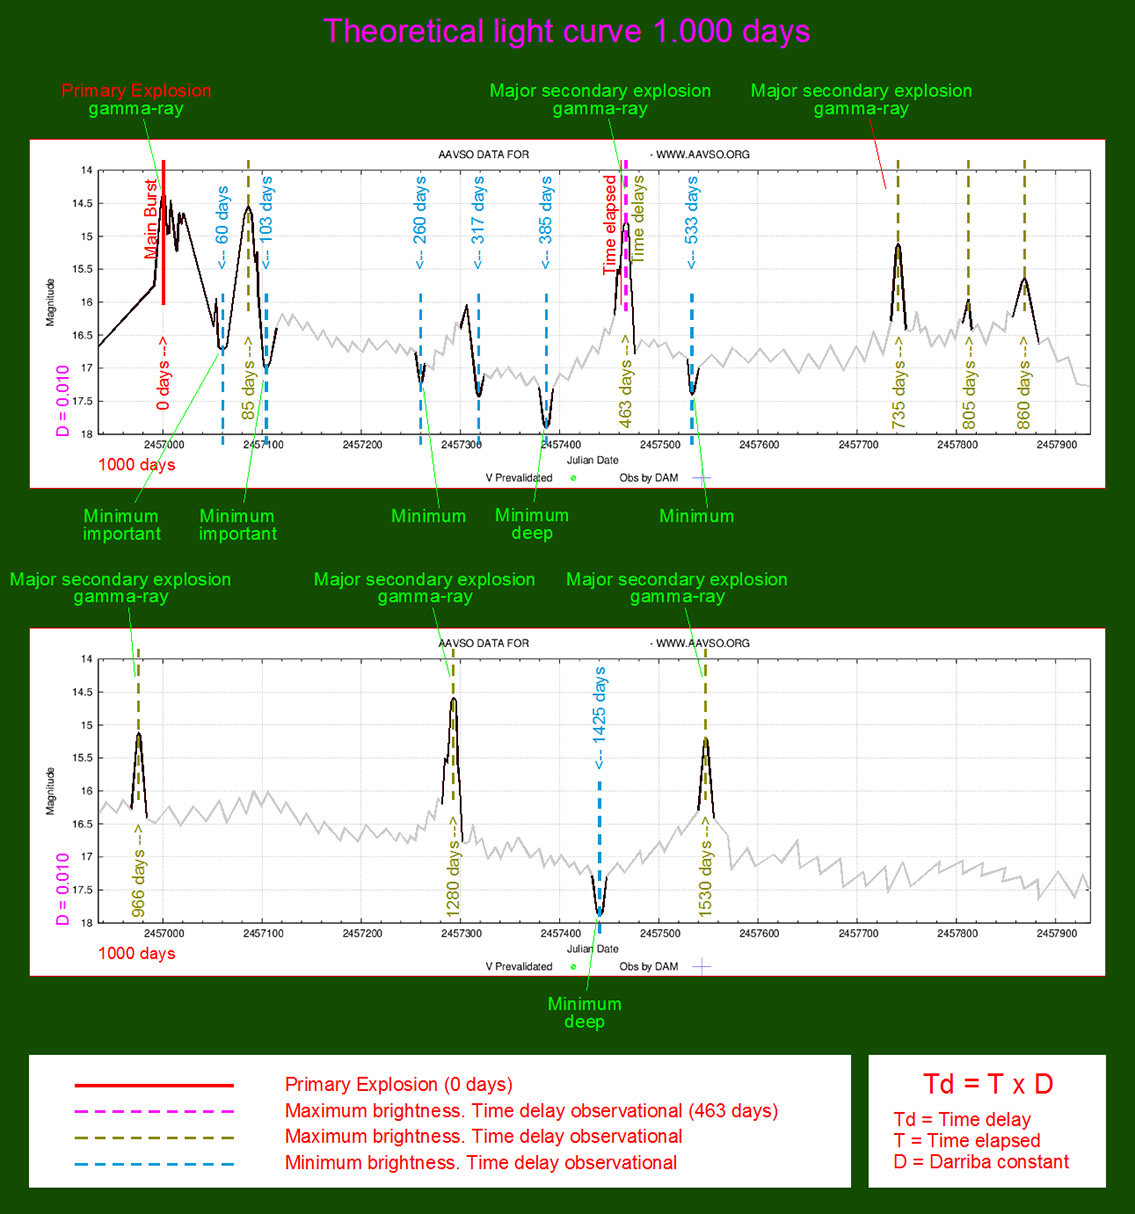
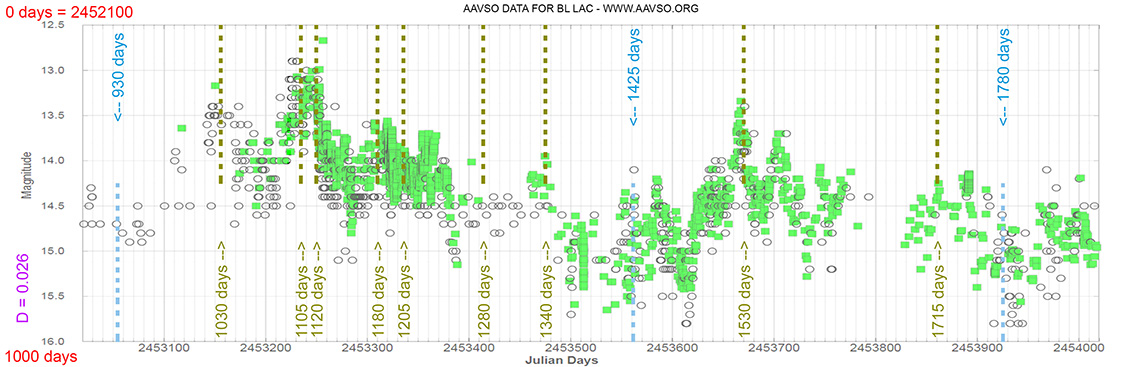
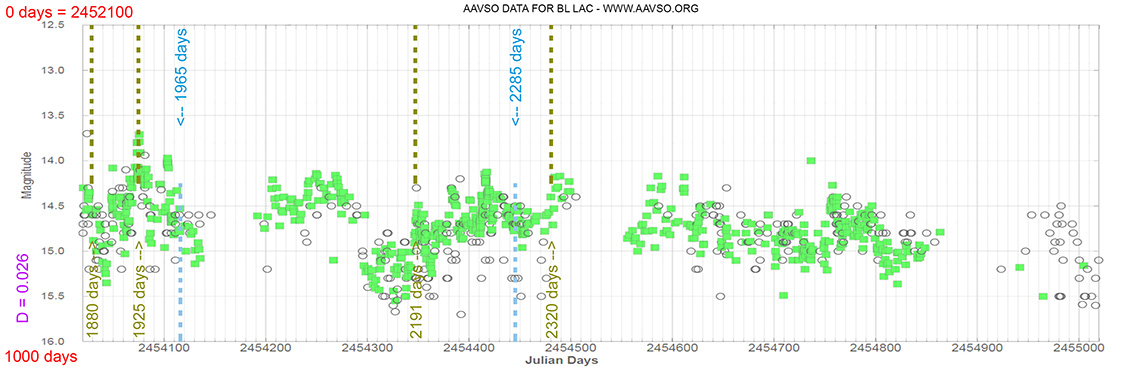
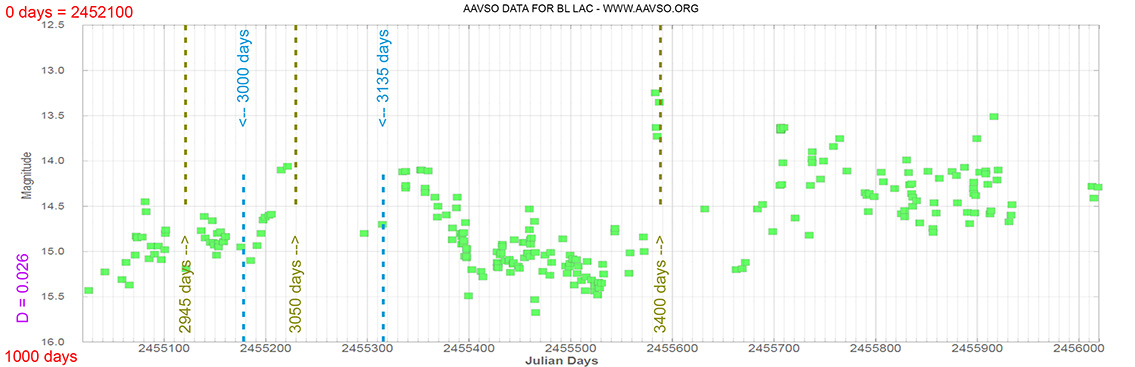
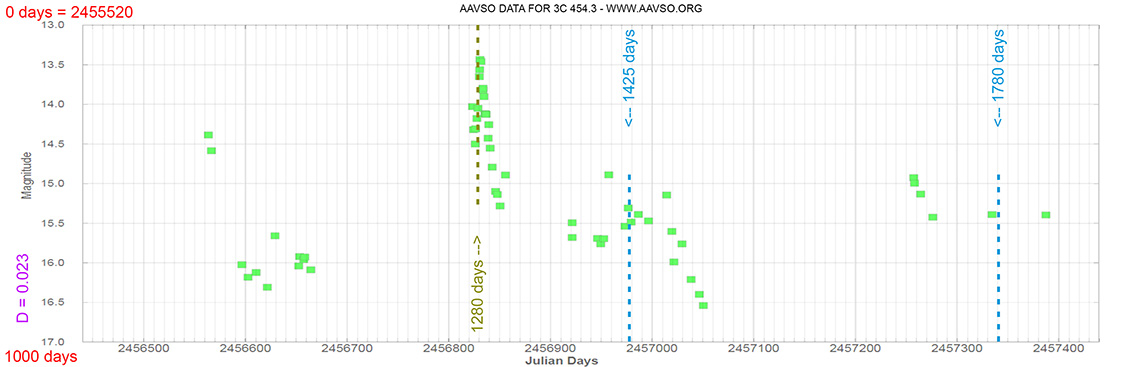
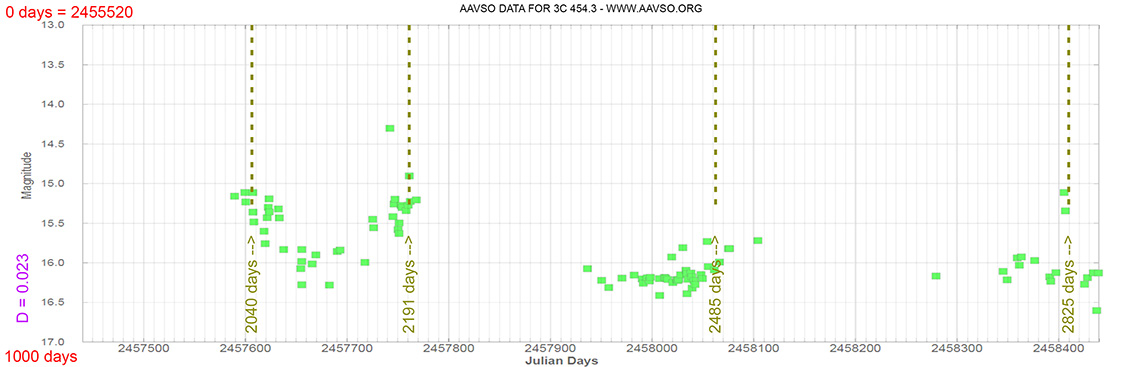
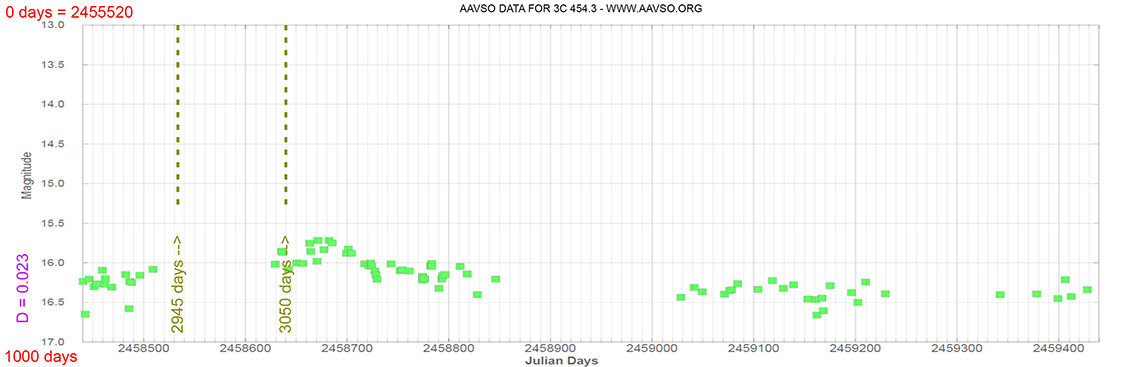
- The Blazares are still predictable. Light curves 1,000 days.
- There are three types of main explosions. Type I, Type II and Type III.
- At the time of a principal explosion, a cascade of stable elements is produced as radioactive.
- The radioactive decays of the different elements cause secondary explosions.
- Depending on the sharpness of the secondary explosions, the width of the jet can be known.
- As radioactive elements behave like well-defined atomic clocks,
when a delay occurs in secondary explosions, it is a clear indication of their time delay.
That is, each Blazar has its own time delay.
|
|
|
- Those of Type I, usually move near their minimum brightness, without large variations occurring
when they reach their secondary explosions, although sometimes there is some significant increase.
Its most important feature is that no explosions are detected between 60 and 100 days.
Its trajectory is usually flat or even descending slightly.
- Those of type II, have a greater movement within the light curve,
detecting an increase in brightness at 75 and 90 days later.
- Those of type III, are the most energetic explosions.
A secondary explosion is detected at 85 days, almost as bright as the main one.
They are the most predictable. Its movement within the light curve is similar to those of Type II.
|
|
|
- In Gamma rays, the main explosion usually happens about 3 to 10 days before the optic.
- In secondary explosions usually occurs with the same time delay as the optical
or about 6 days later.
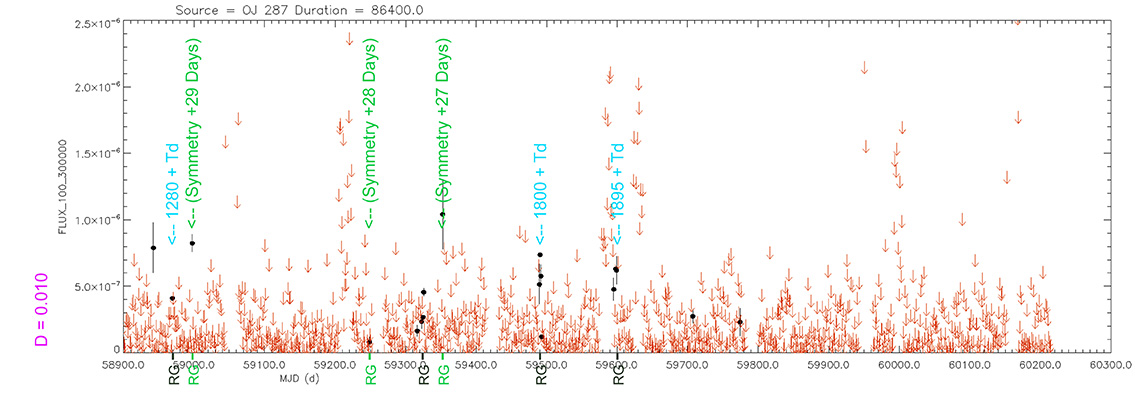
- Occasionally, a Gamma flash is observed three or four weeks apart from the previous,
which would correspond to a maximum of light in the optic.
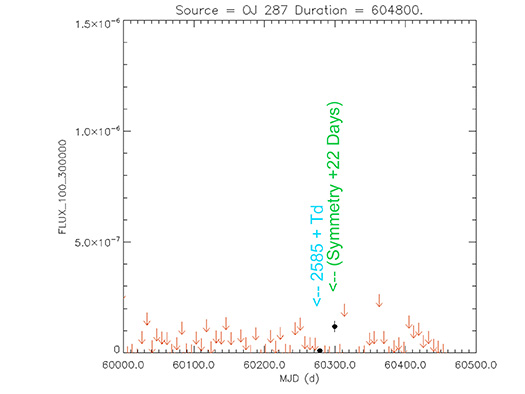
- This symmetry is produced because the two lobes are connected and we would be seeing the Gamma flash
coming from the opposite lobe. That is, we would see a symmetry in the Gamma flash,
not being the same in their detection, although physically they would be the same.
- The time taken from the first Gamma flash to the second is the distance that the two lobes are separated.
It is not strictly correct because space-time is dragged and this greatly influences this appreciation.
- It is possible that the symmetry is produced by the precession of the two emitting lobes, when rotating.
Hence, the symmetry of each blazar never occurs in a certain exact time.
|
|
|
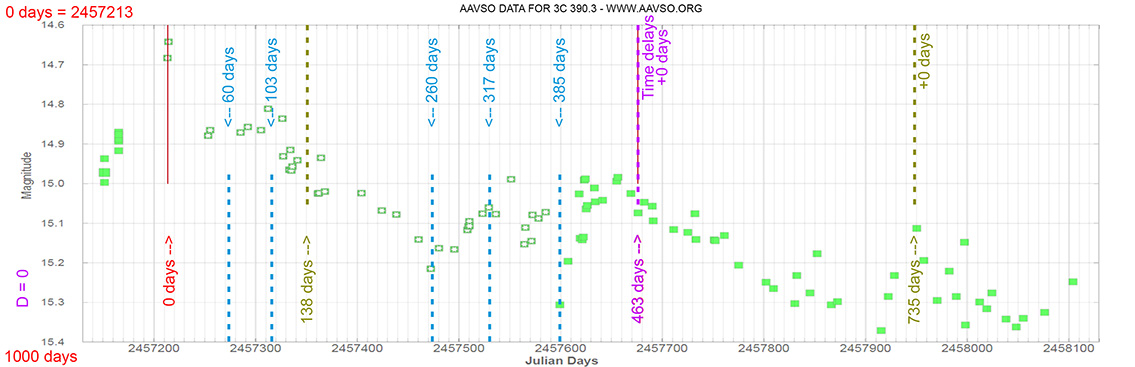
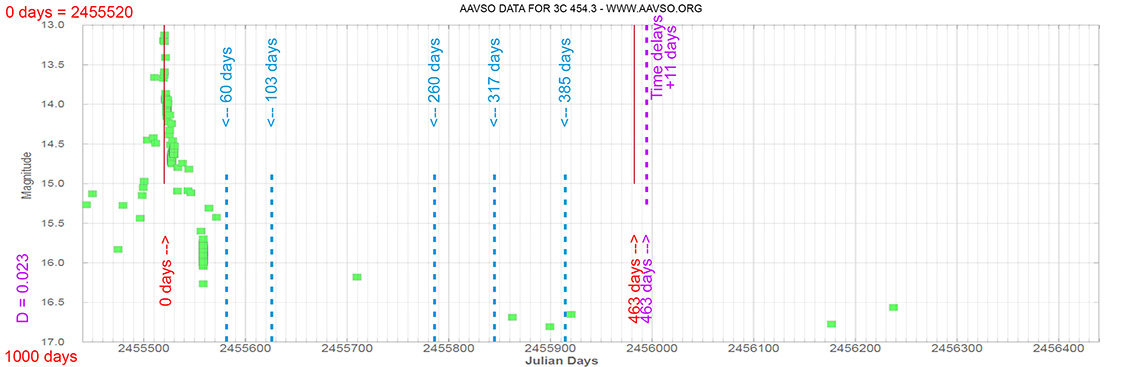
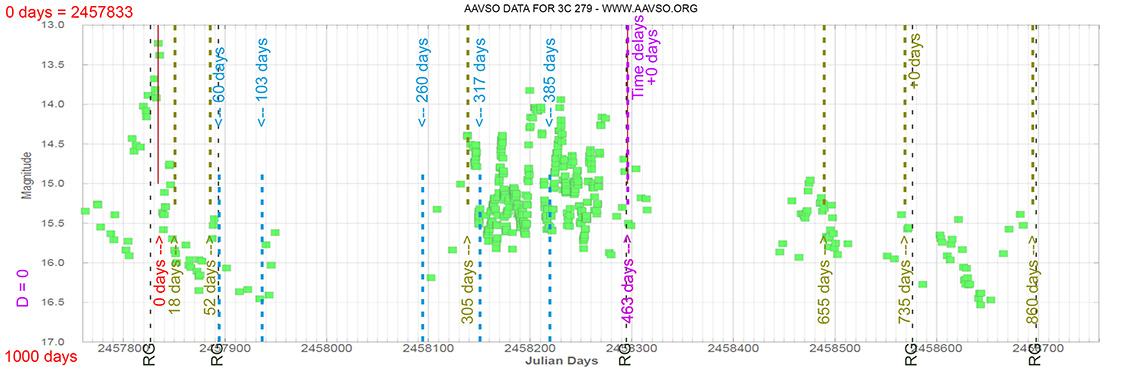
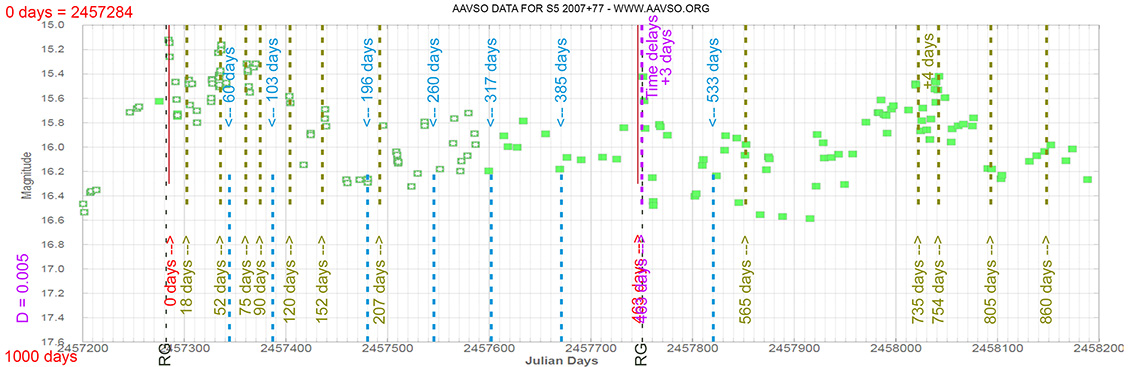
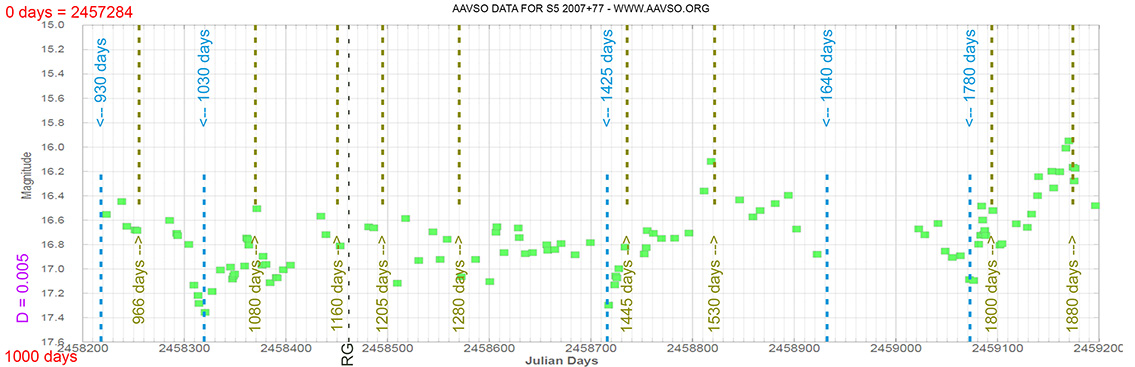
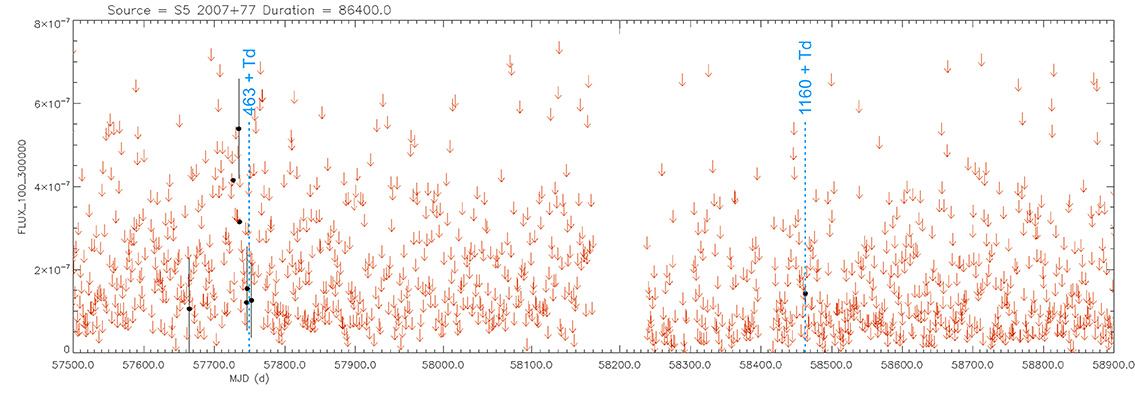
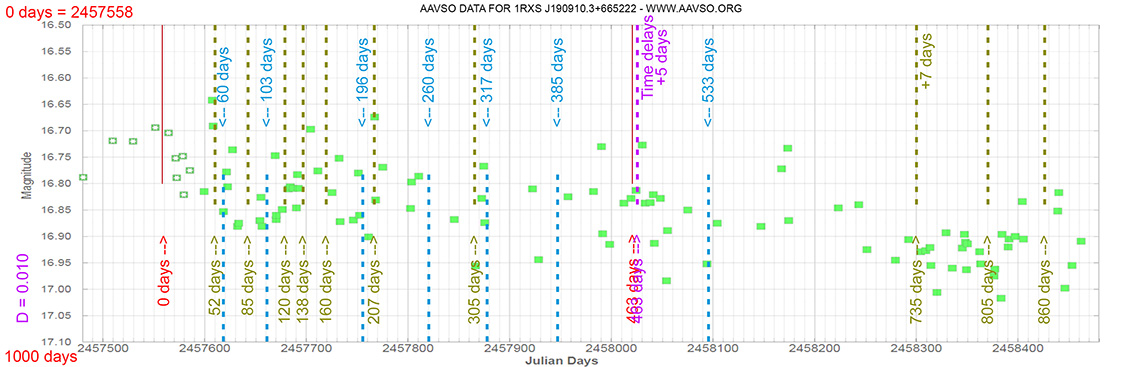
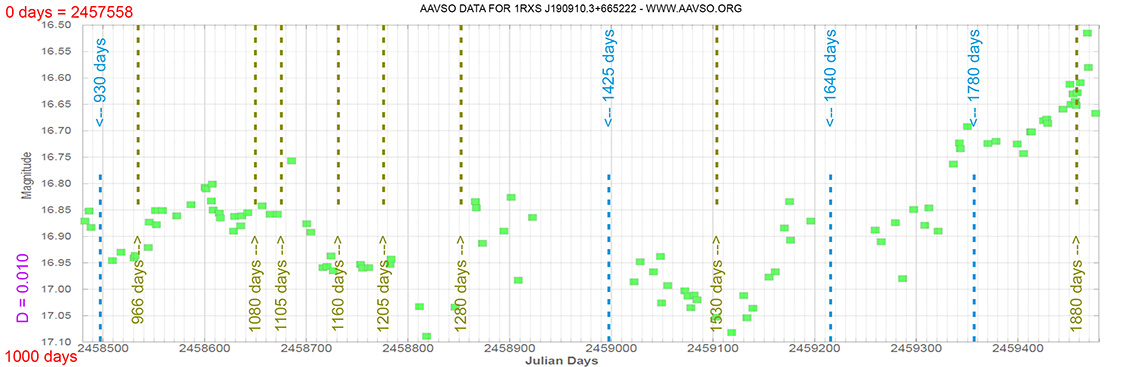
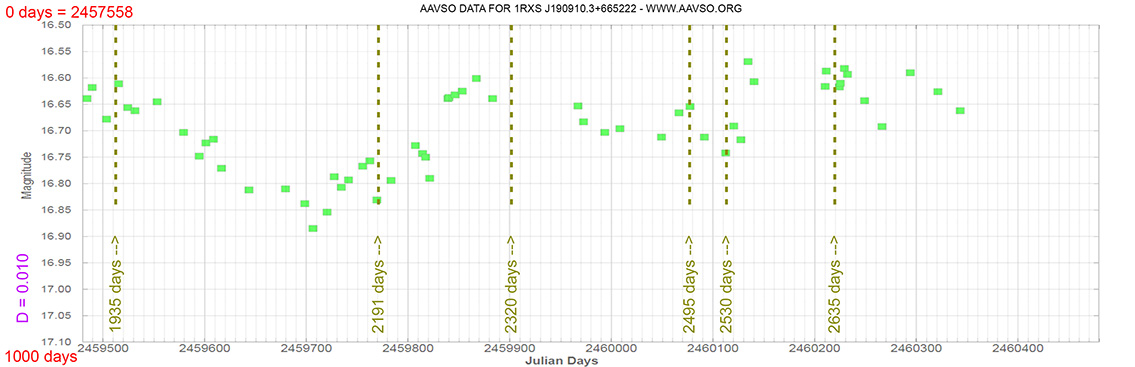
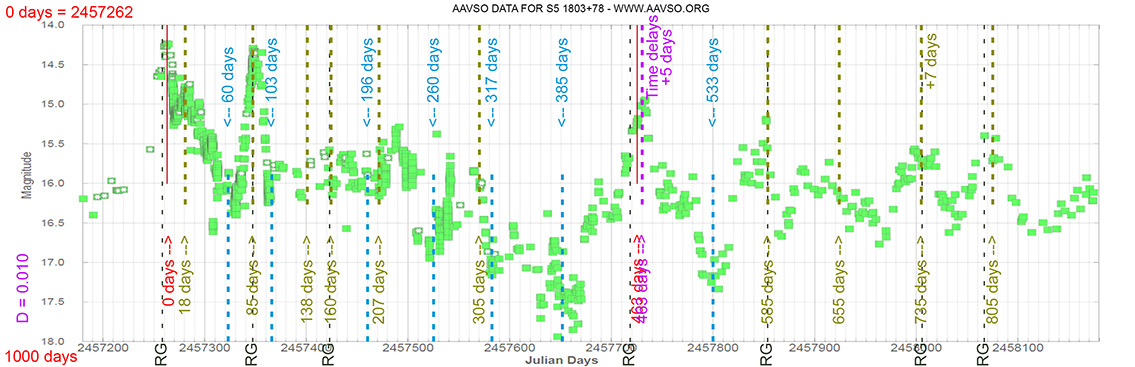
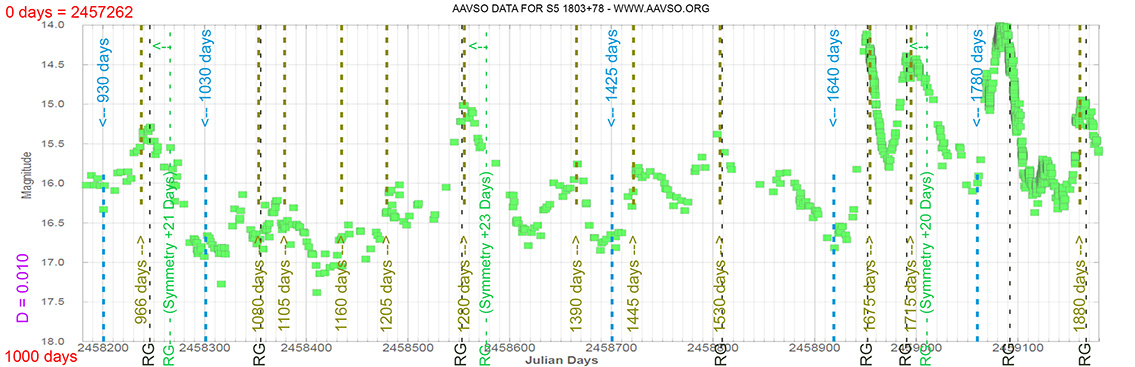
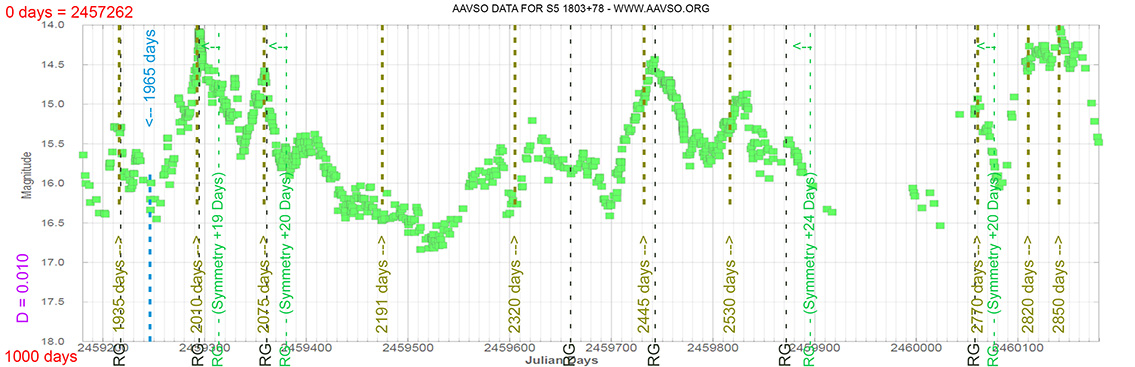
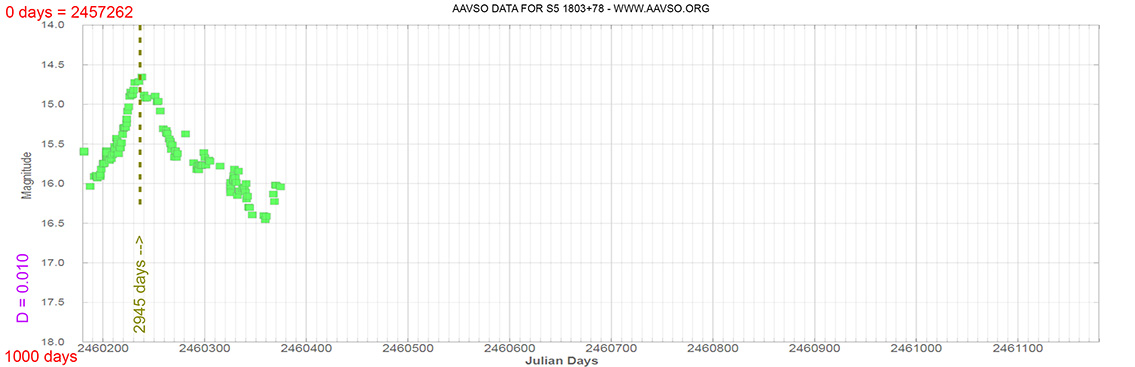
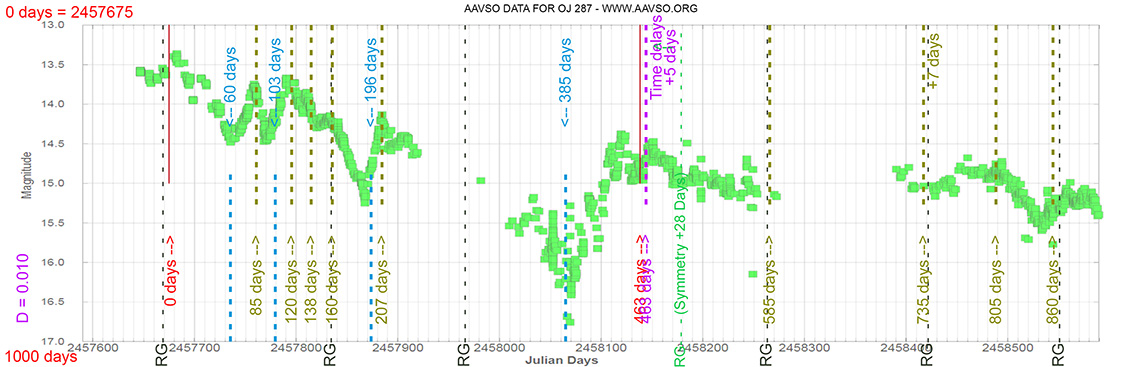
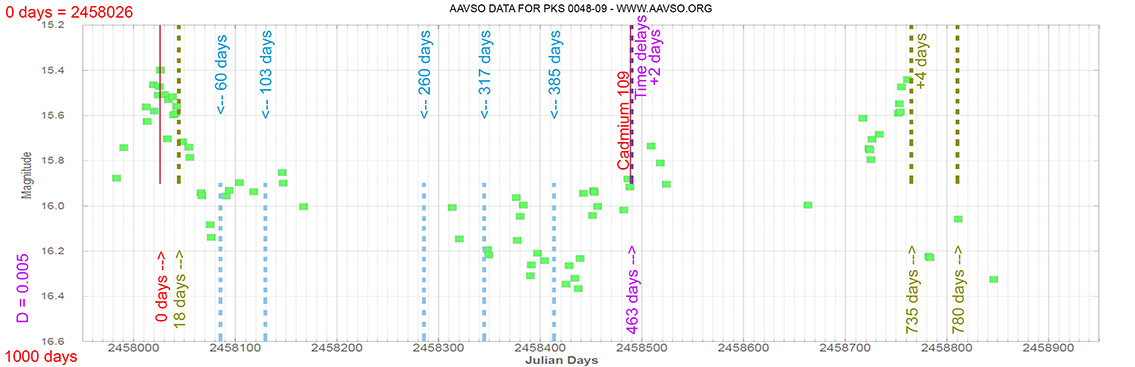
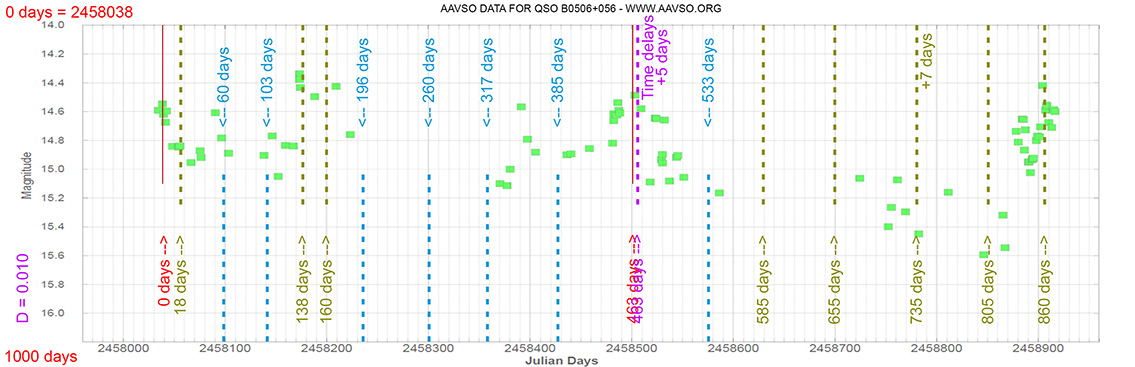
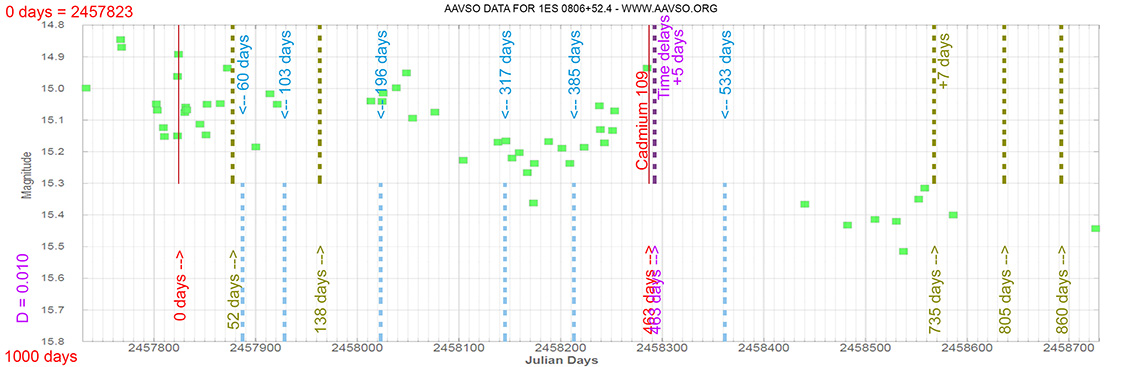
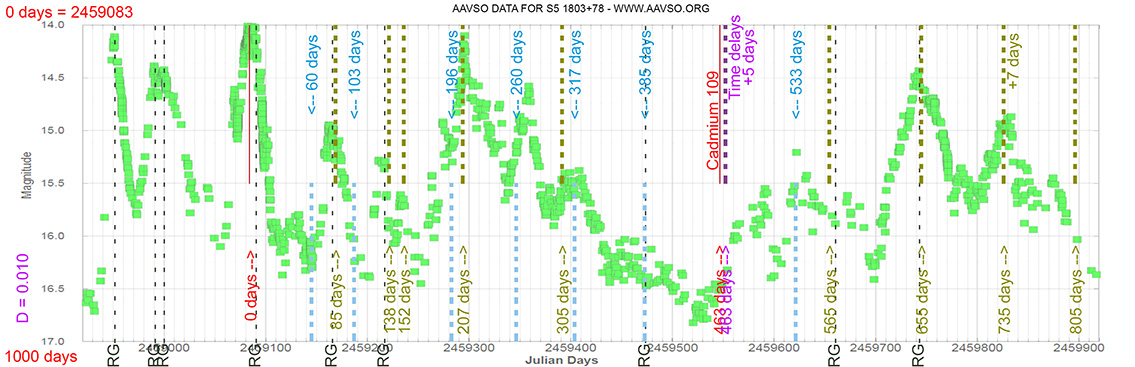
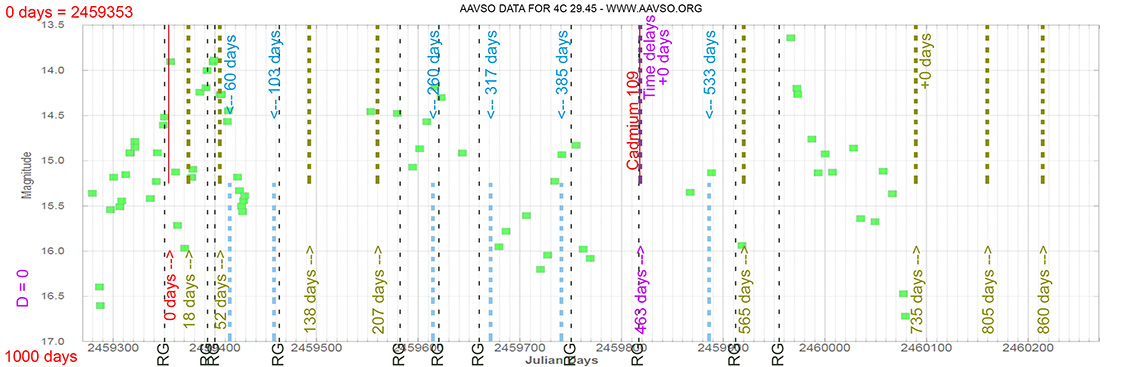
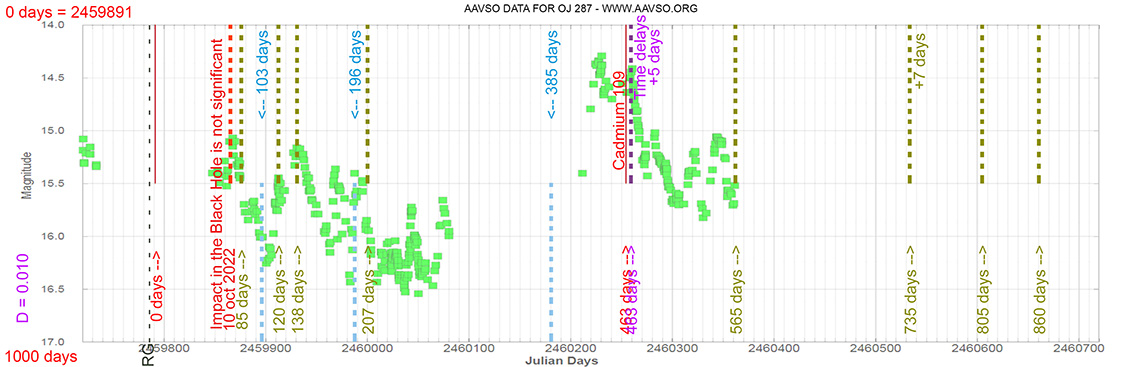
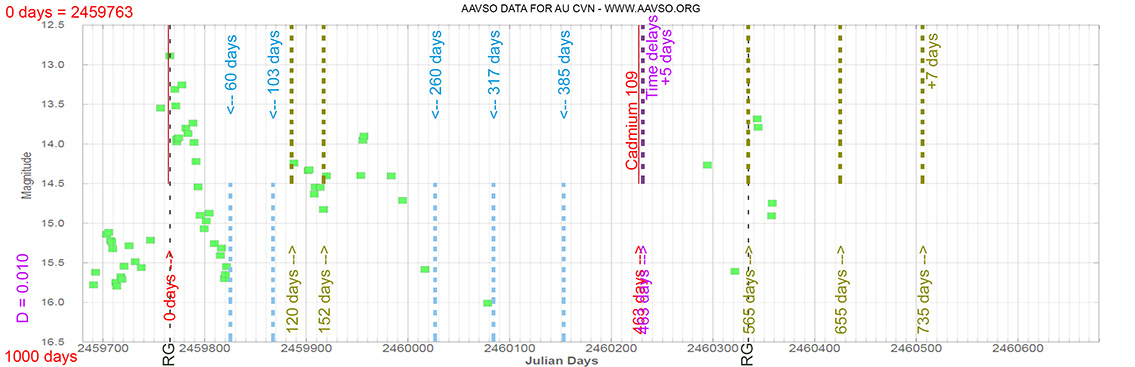
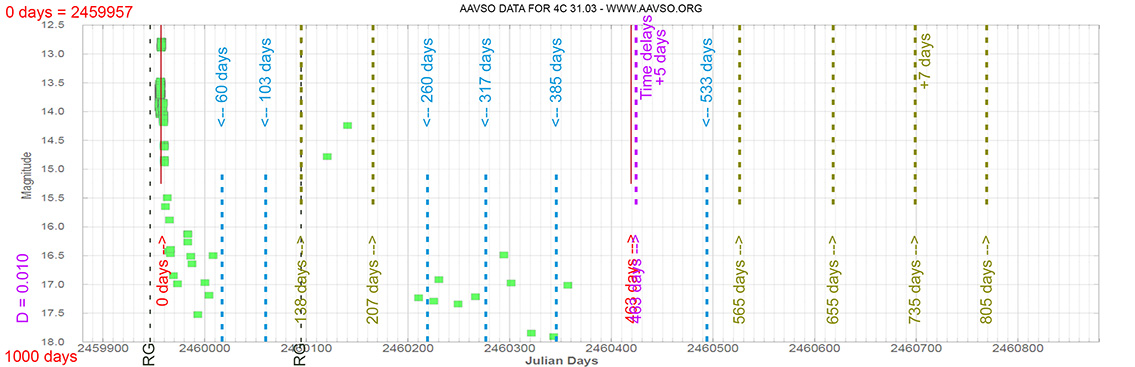
Each Blazar has its own time delay, so I apply a constant (D).
In my theoretical model above, the constant could be: D = 0.010
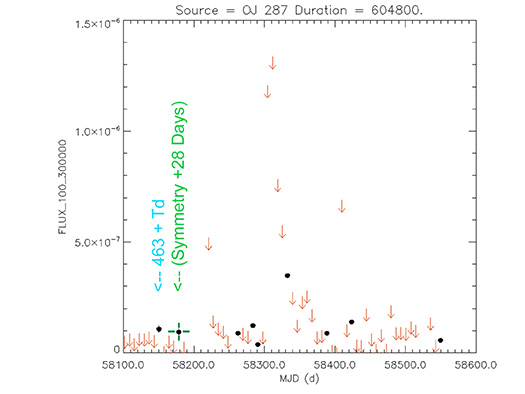
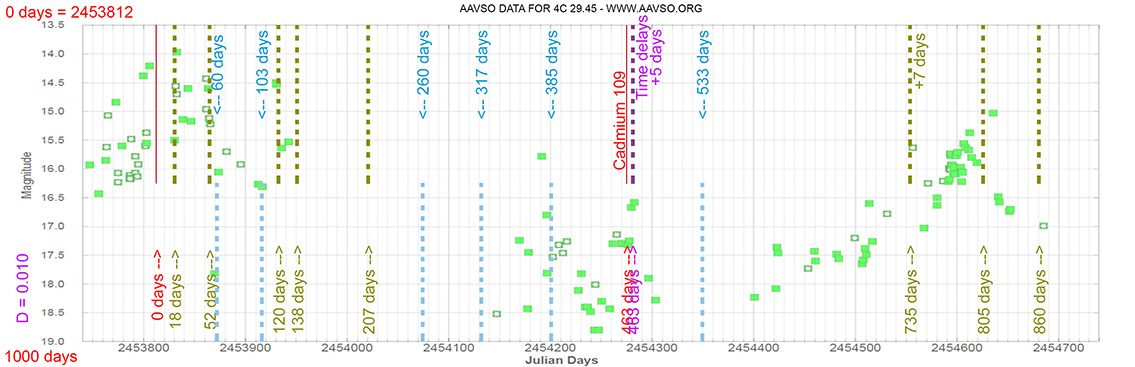
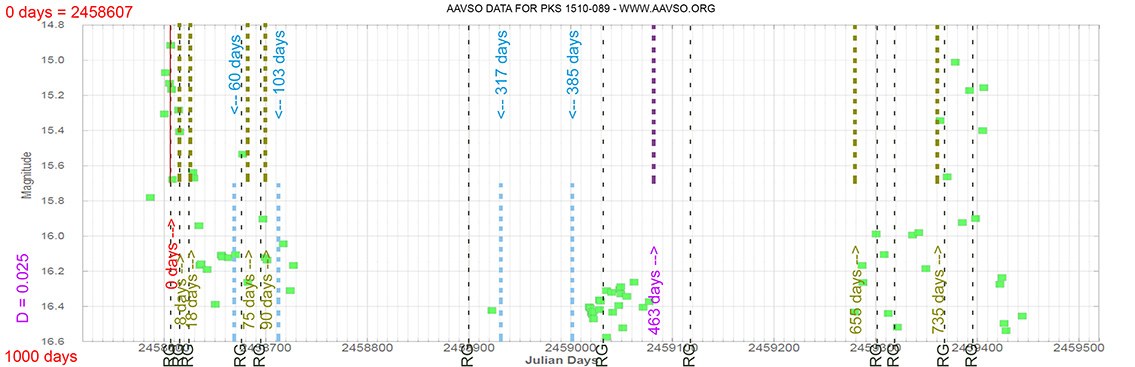
That is, when the maximum brightness occurs at 463 days (T), its time delay corresponds (Td):
Td = T x D // Td = 463 x 0.010 // Td = 5 Days
(The maximum would occur 5 days later)
and when it reaches 735 days (T), it corresponds to:
Td = T x D // Td = 735 x 0.010 // Td = 7 Days
(The maximum would occur 7 days later)
As can be seen, the time delay (Td) is proportional to the elapsed time (T).
|

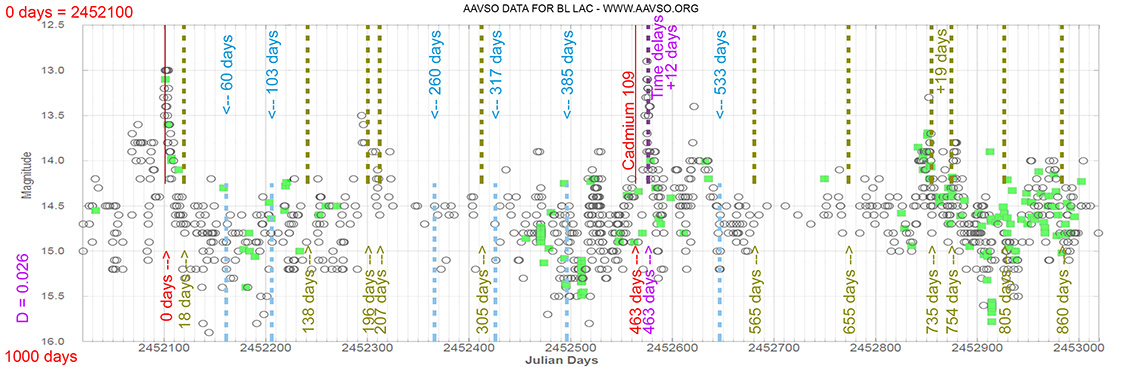
Blazar
BL LAC
(22 02 43.29139 +42 16 39.9803) z=0.069
Seyfert 1 Galaxy
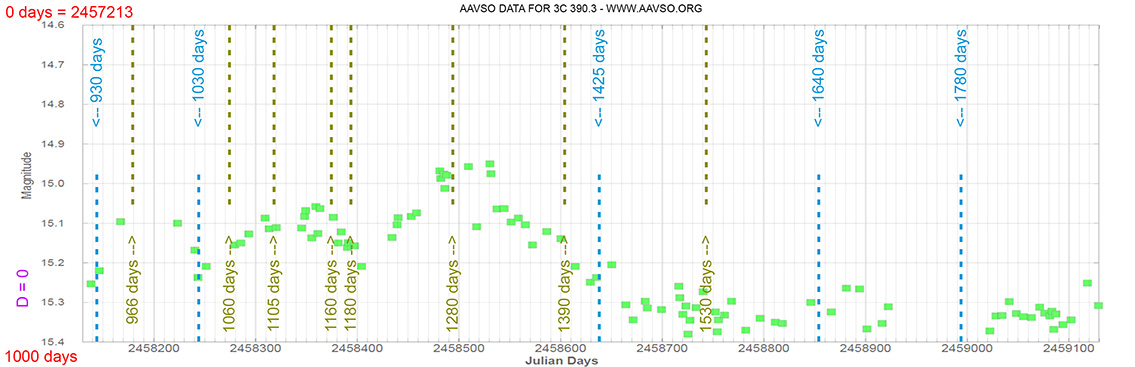
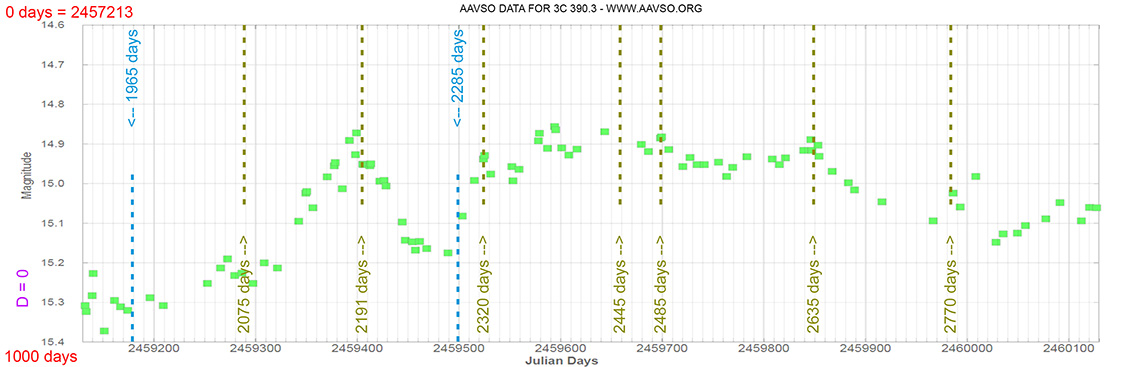
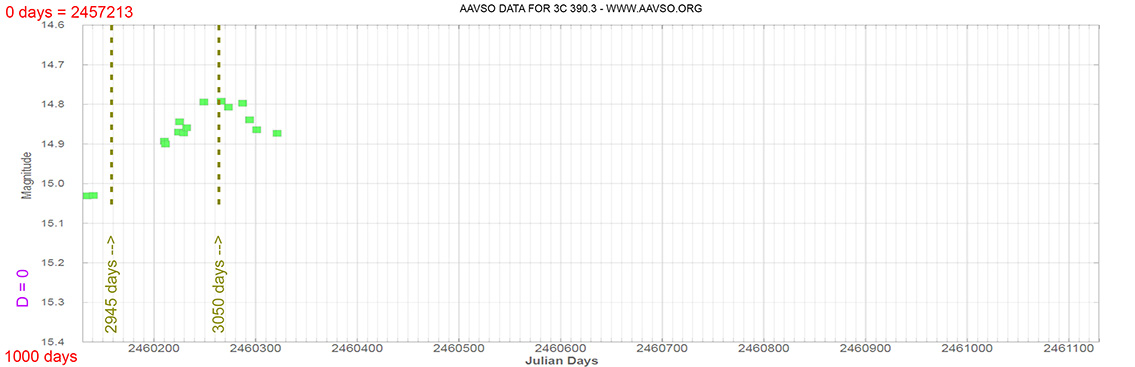
3C 390.3
(18 42 08.9899 +79 46 17.128) z=0.056159
Quasar
3C 454.3
(22 53 57.74798 +16 08 53.5611) z=0.859001
Quasar
3C 279
(12 56 11.16657 -05 47 21.5247) z=0.53620
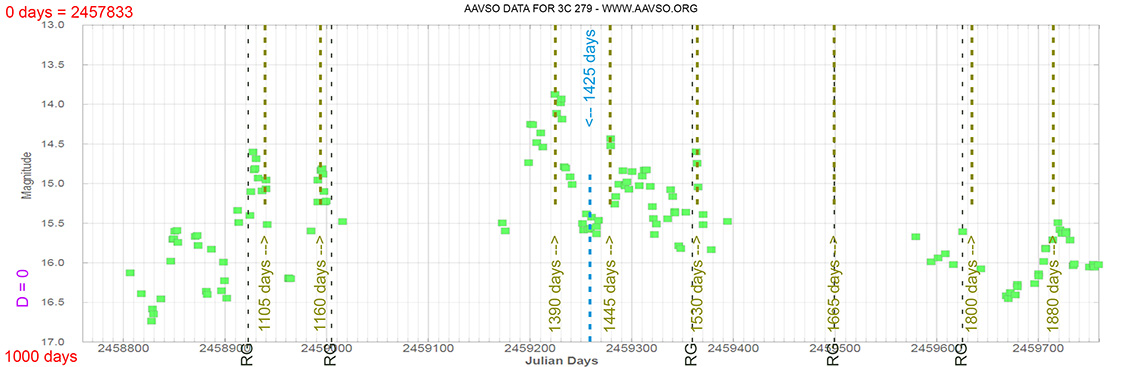
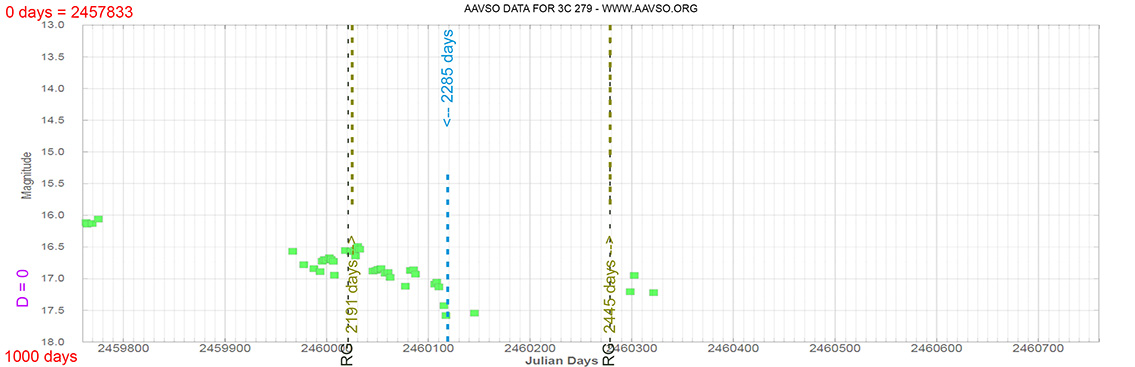
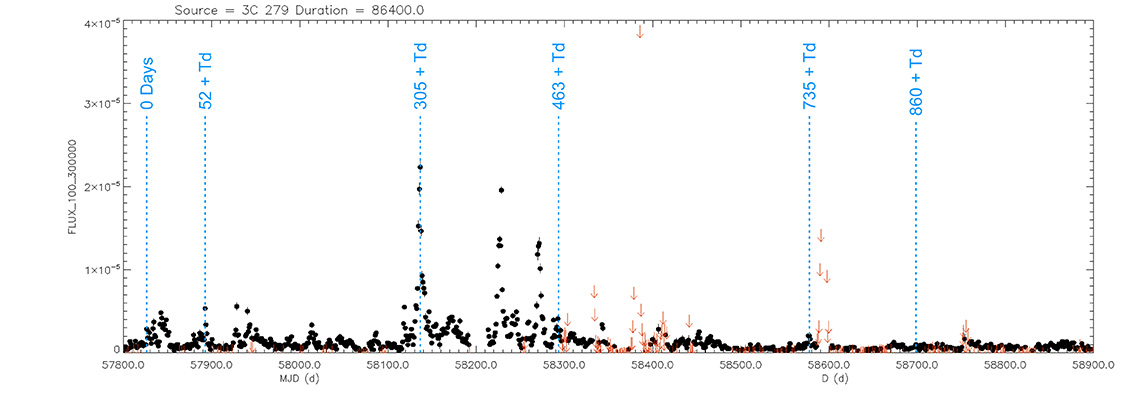
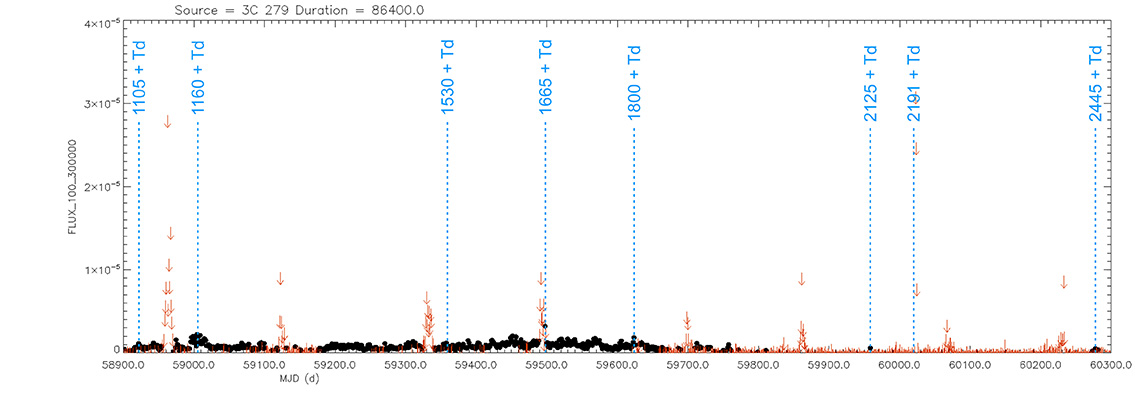
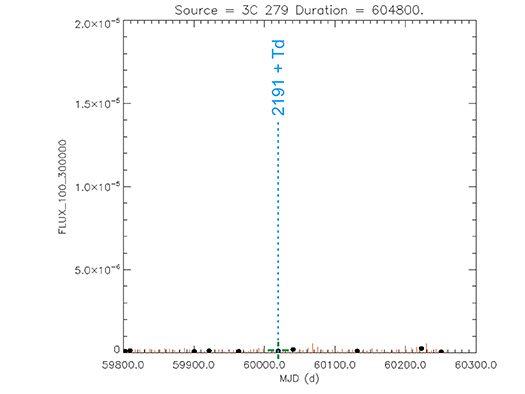
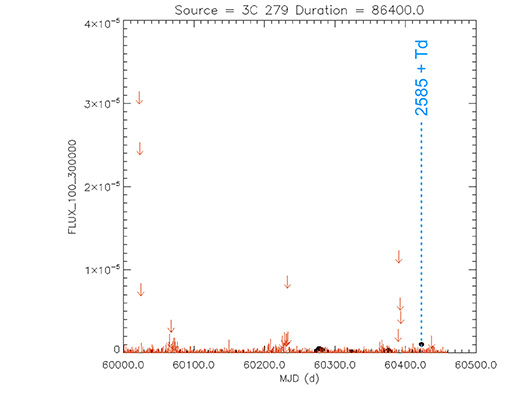
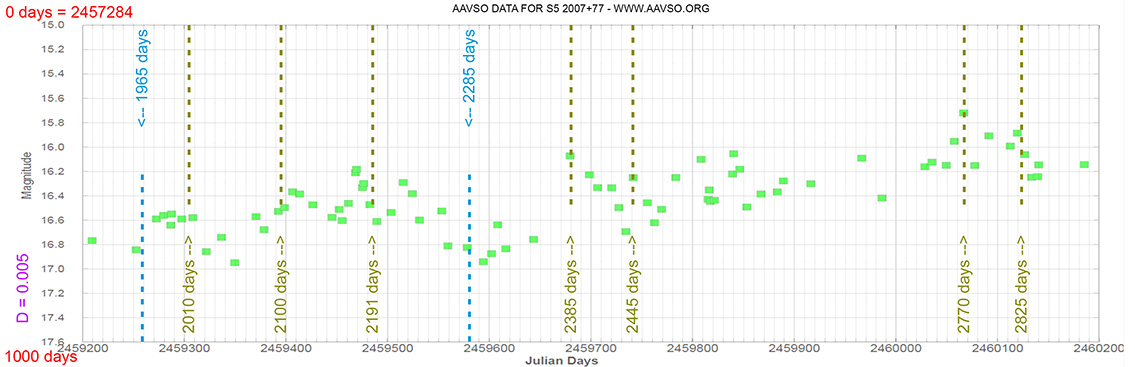
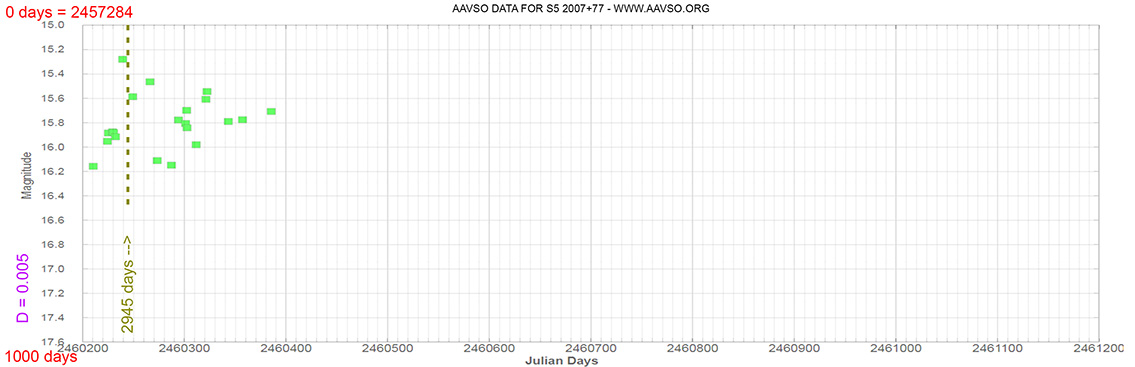
Light curve. NASA's Fermi Gamma-ray Space Telescope
Blazar
S5 2007+77
(20 05 31.004 +77 52 43.27) z=0.342
The Astronomer’s Telegram.
Nş 8635
Burst Gamma ray. 4 Feb 2016
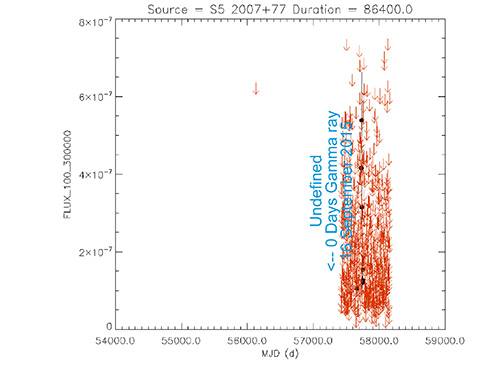
Light curve. NASA's Fermi Gamma-ray Space Telescope
Quasar
PKS 0736+01
(07 39 18.03390 +01 37 04.6179) z=0.191
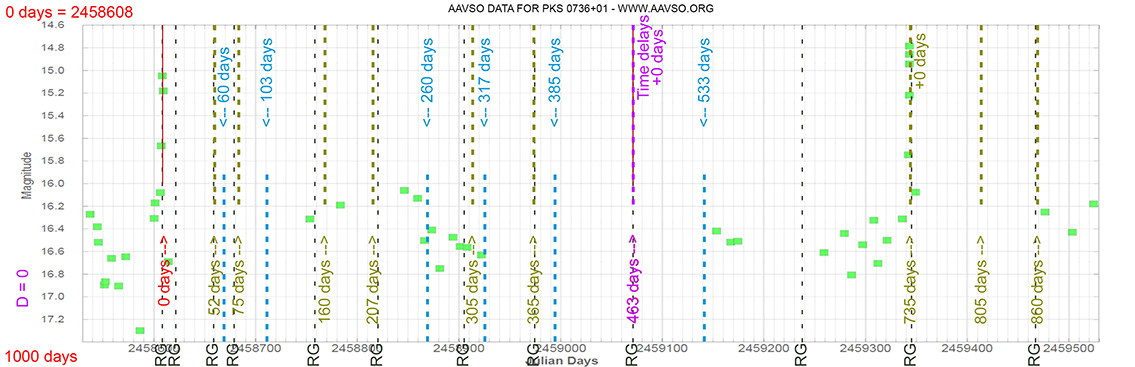
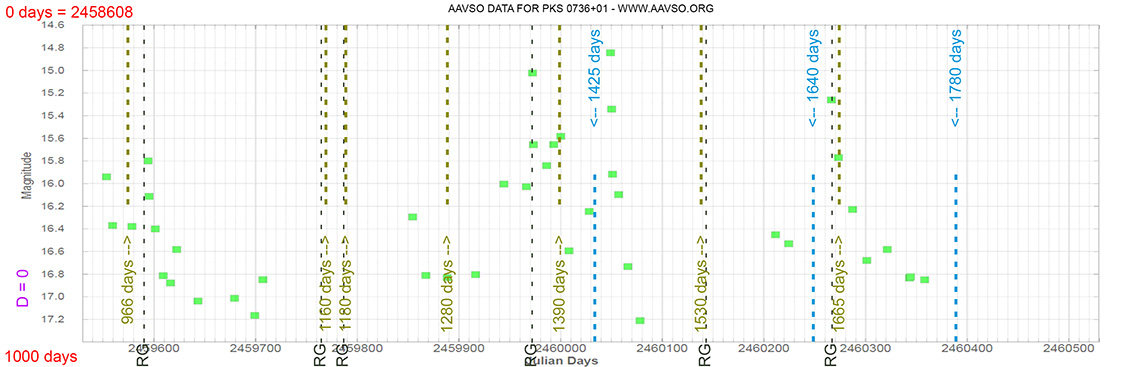
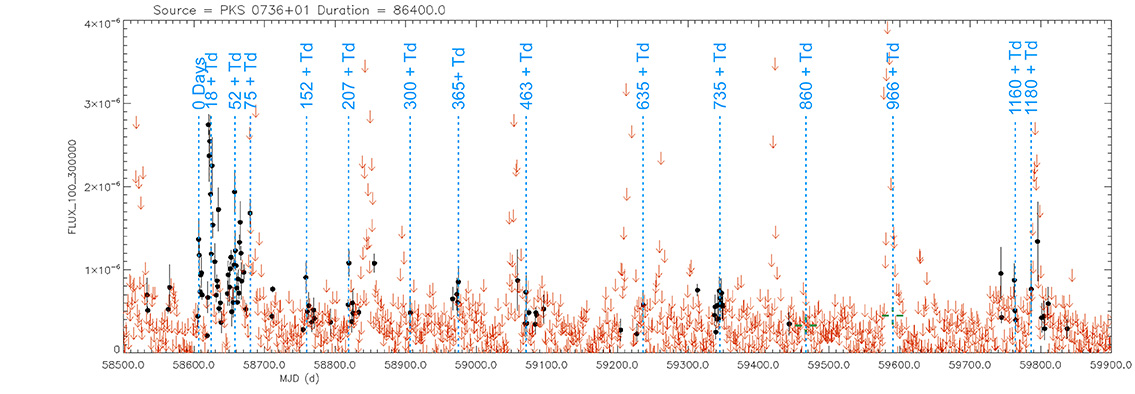
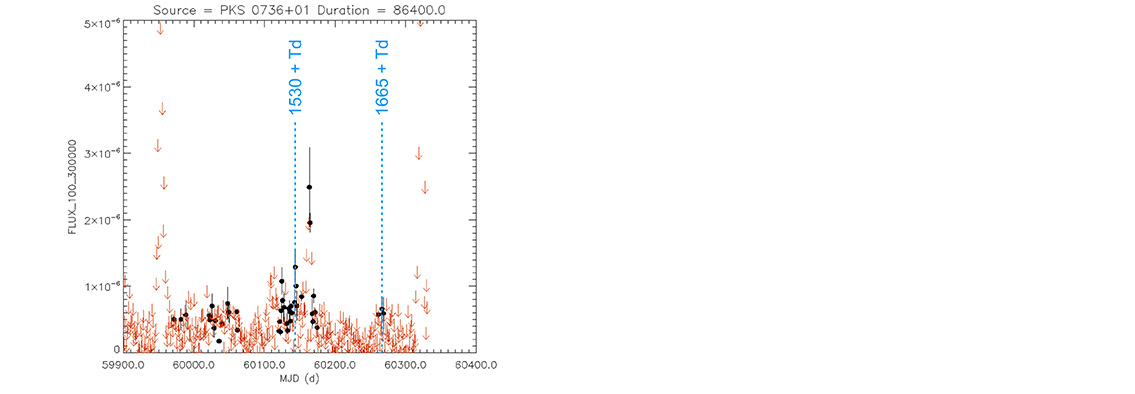
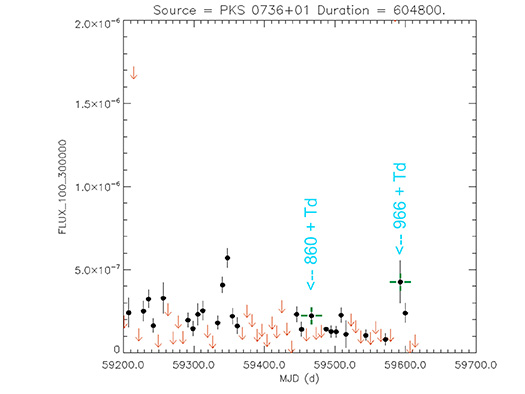
Light curve. NASA's Fermi Gamma-ray Space Telescope
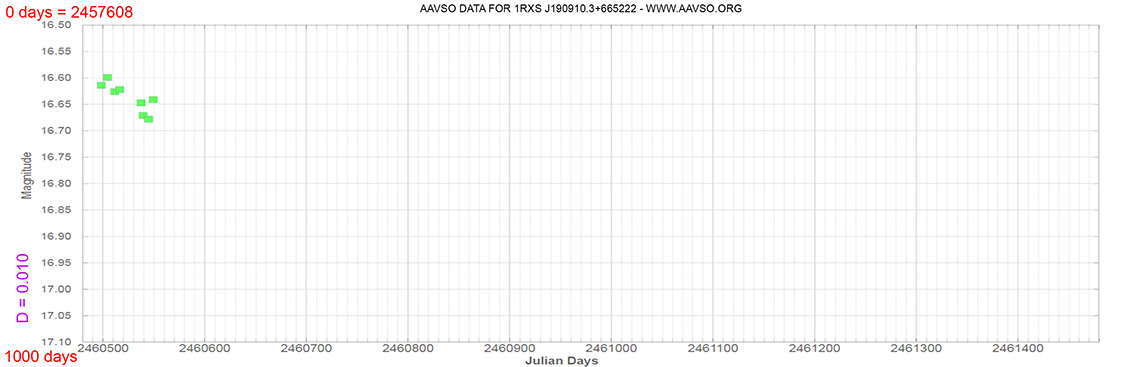
Seyfert 1 Galaxy
1RXS J190910.3+665222
(19 09 10.8964 +66 52 21.373) z=0.191
Blazar
PKS 0716+71
(07 21 53.44846 +71 20 36.3634) z=0.300
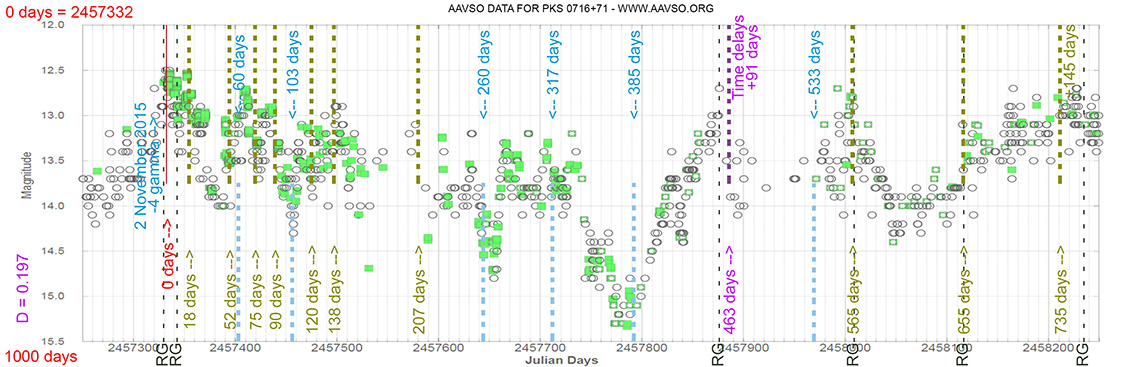
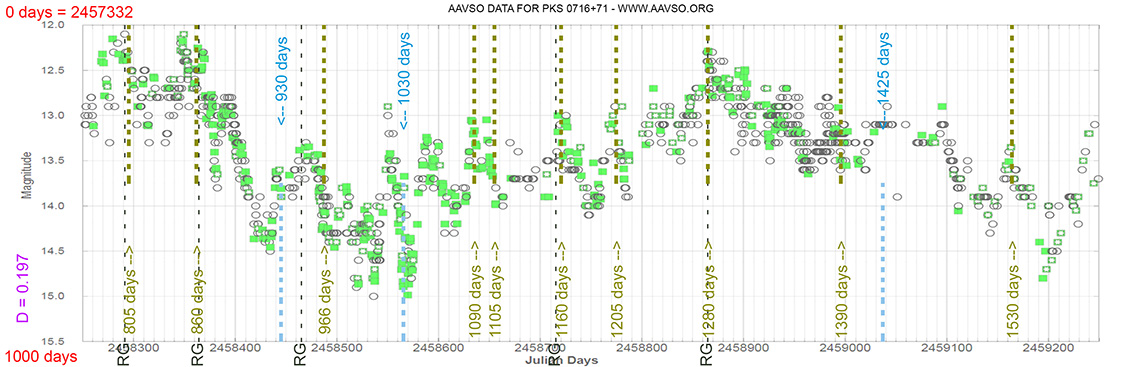
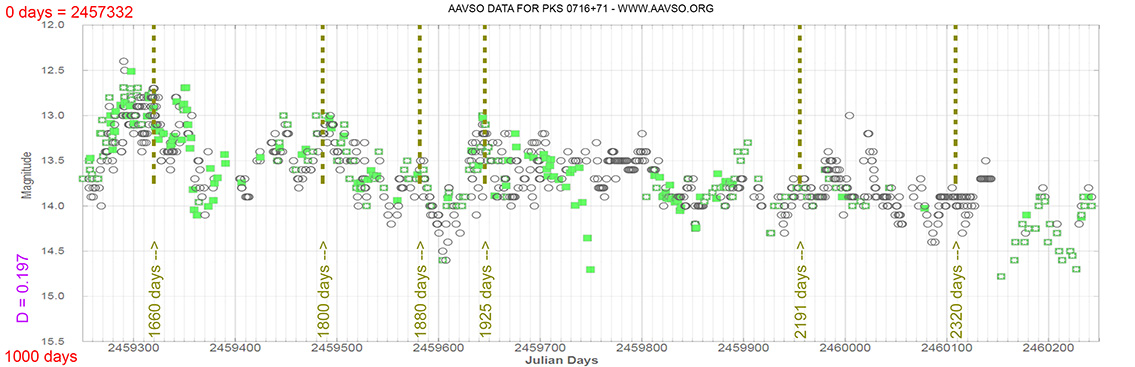
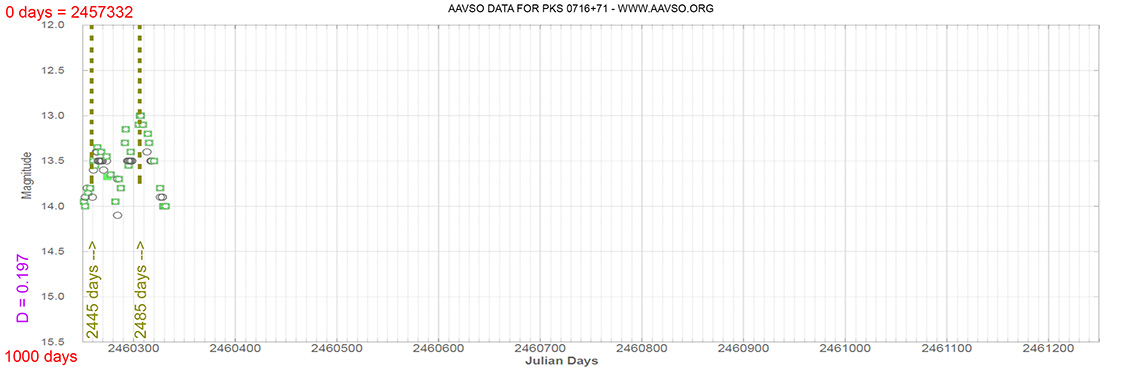
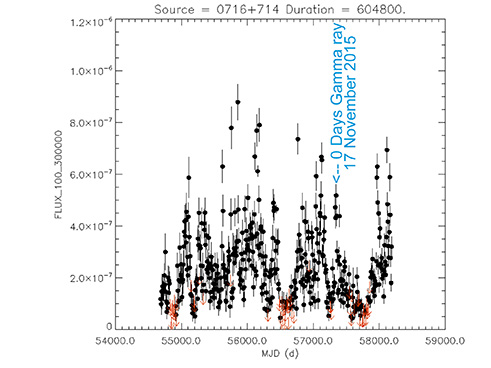
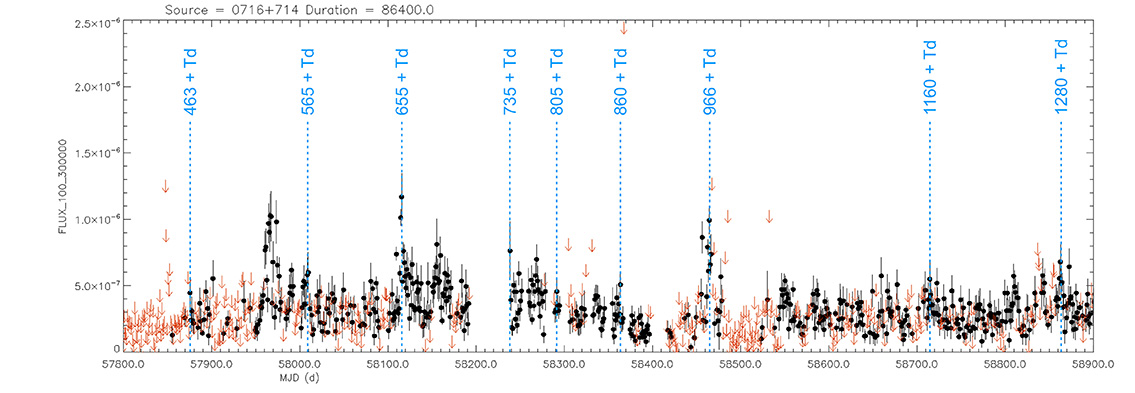
Light curve. NASA's Fermi Gamma-ray Space Telescope
Blazar
OT 081
(17 51 32.81855 +09 39 00.7288) z=0.322
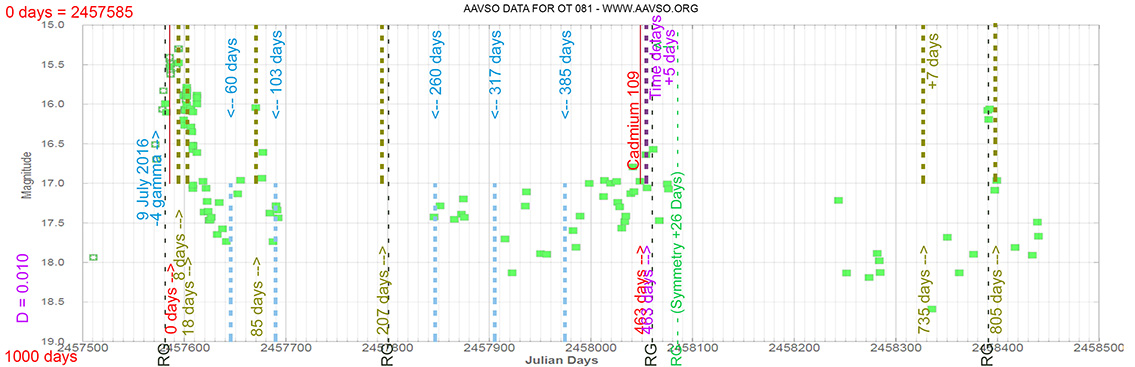
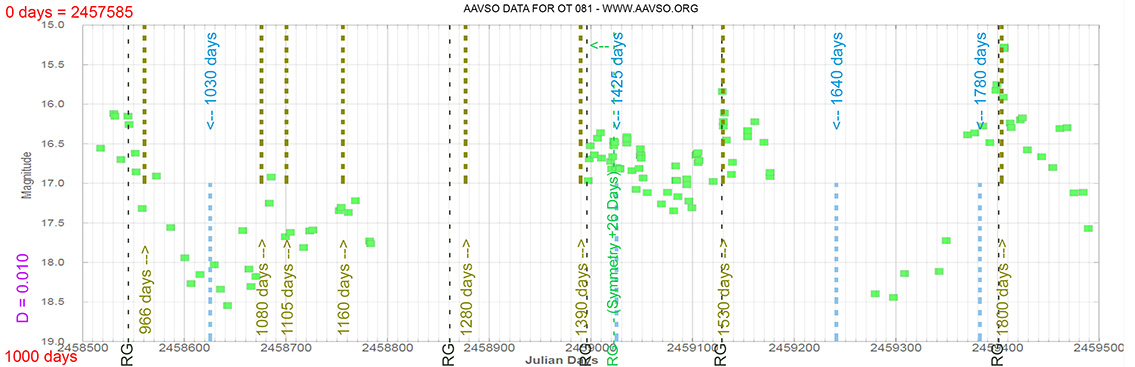
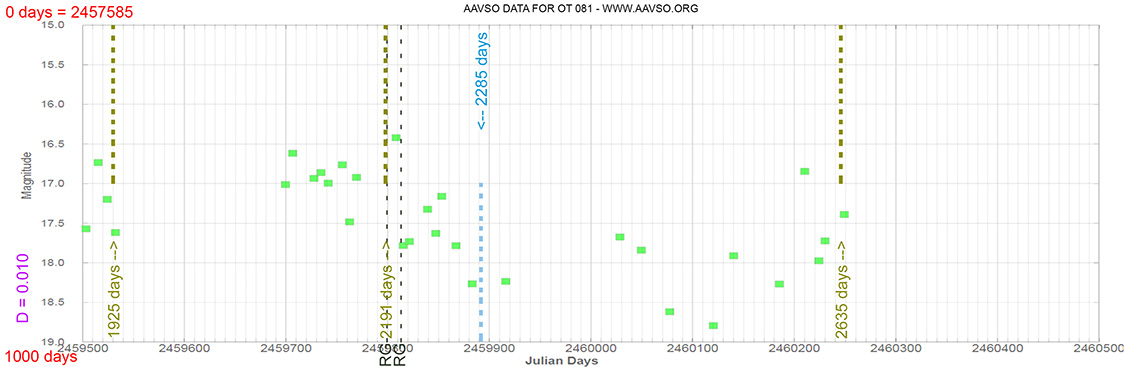
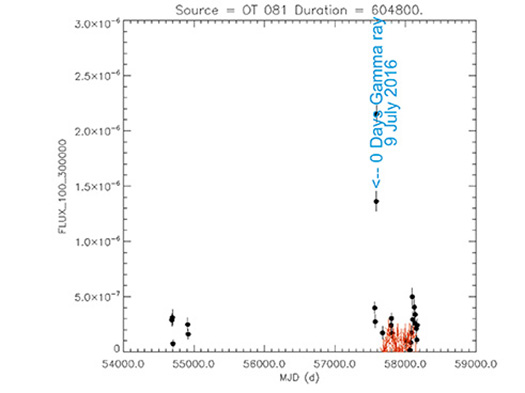
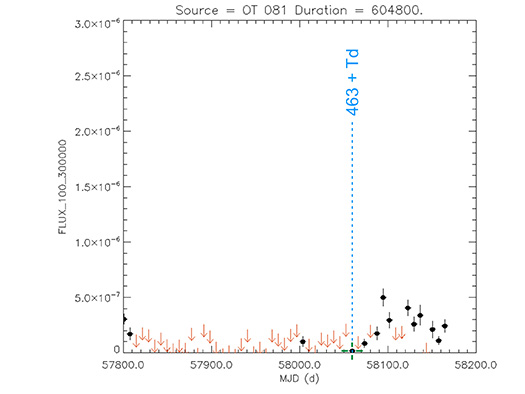
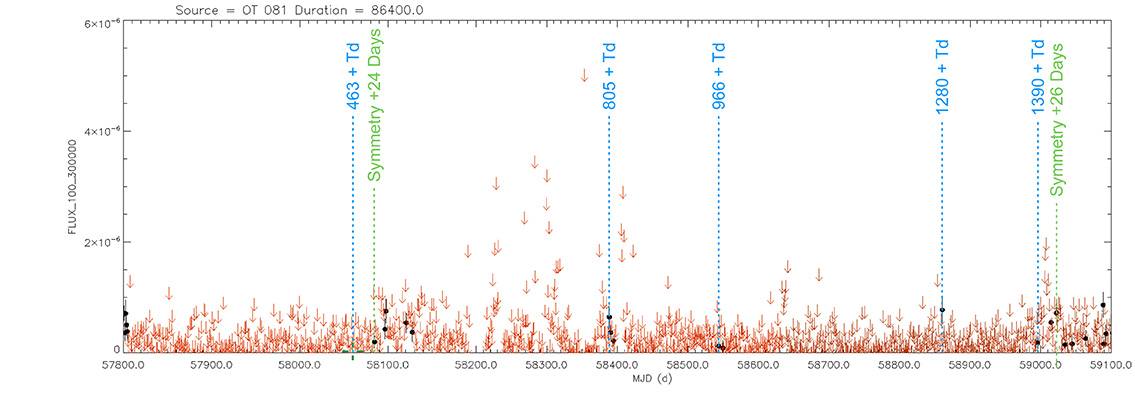
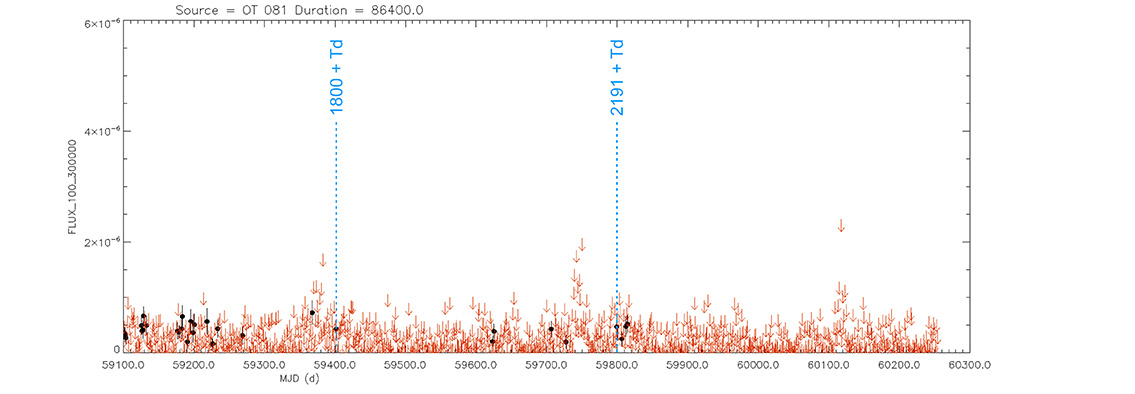
Light curve. NASA's Fermi Gamma-ray Space Telescope
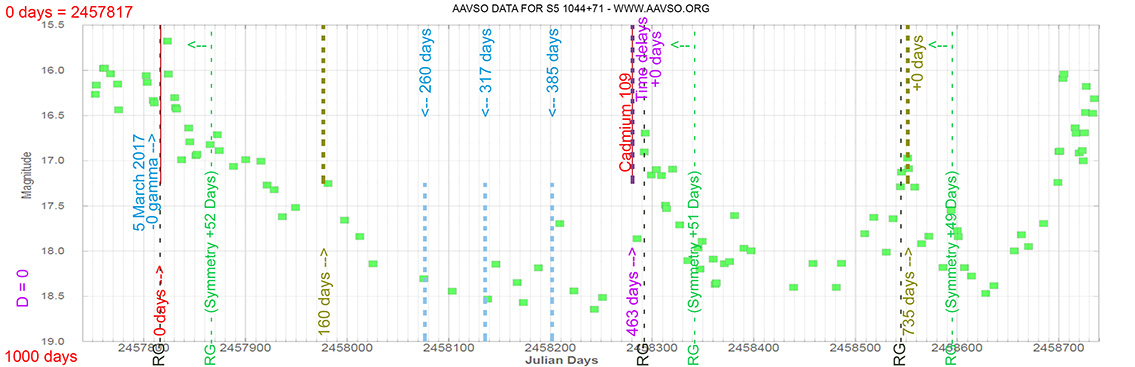
Quasar
S5 1044+71
(10 48 27.6 +71 43 36) z=1.1500
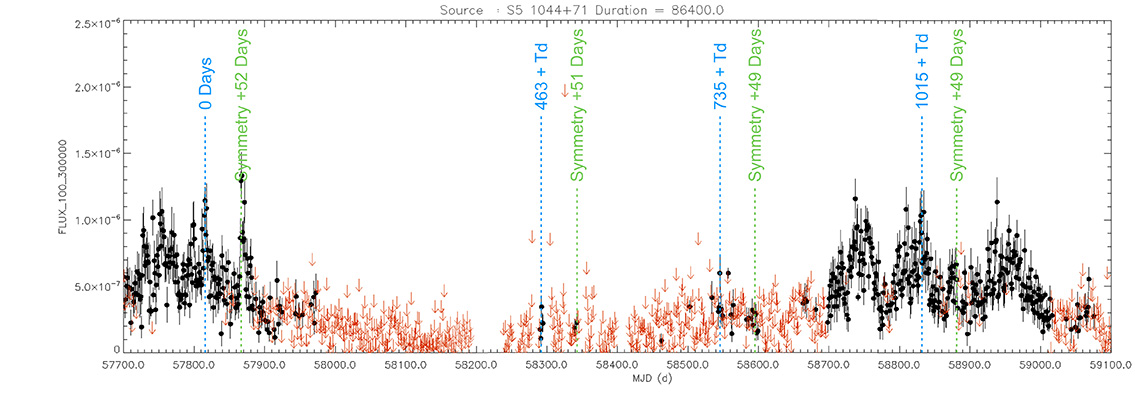
Light curve. NASA's Fermi Gamma-ray Space Telescope
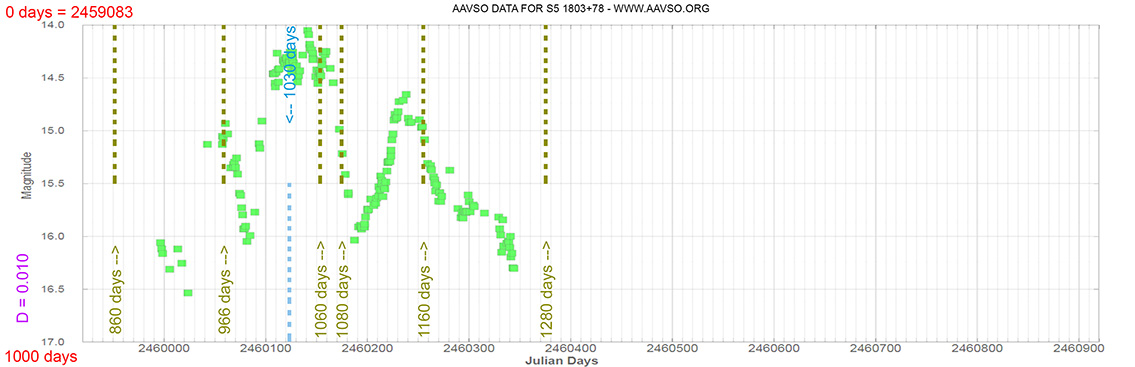
Blazar
S5 1803+78
(18 00 45.684 +78 28 04.02) z=0.680
The Astronomer’s Telegram.
Nş 7933
Burst Gamma ray. 20 Aug 2015
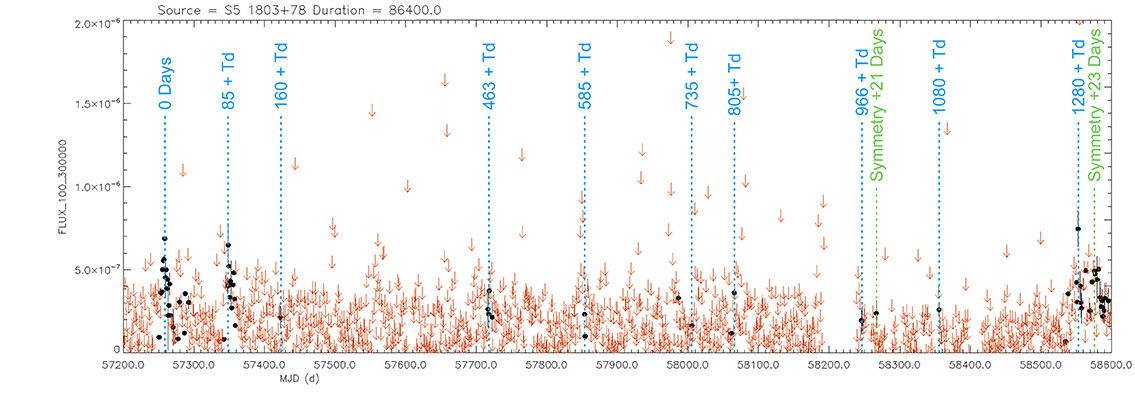
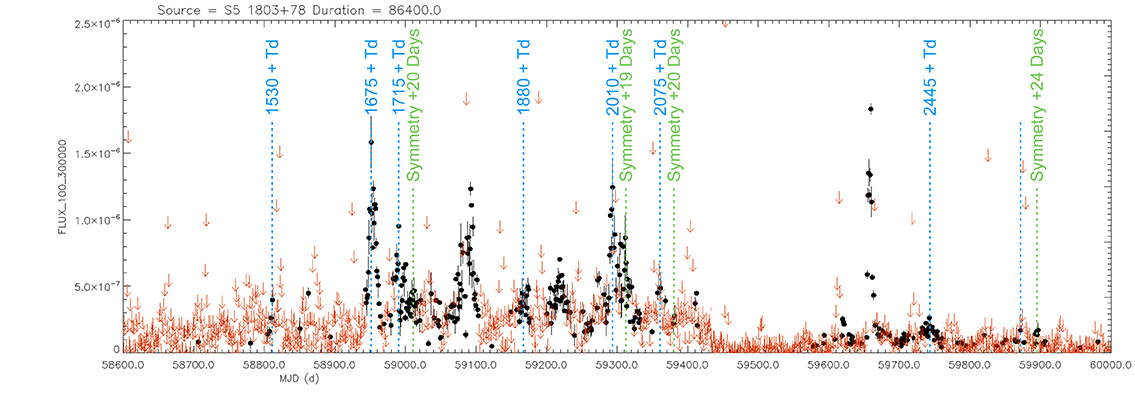
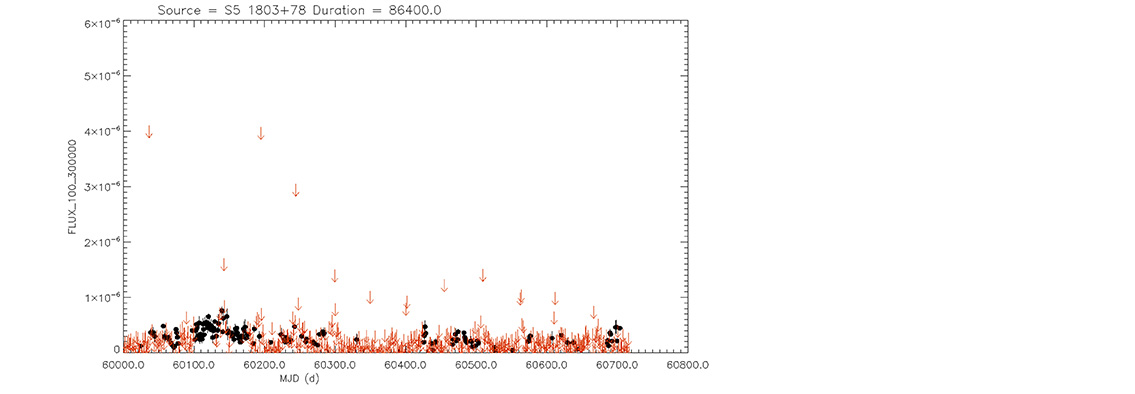
Light curve. NASA's Fermi Gamma-ray Space Telescope
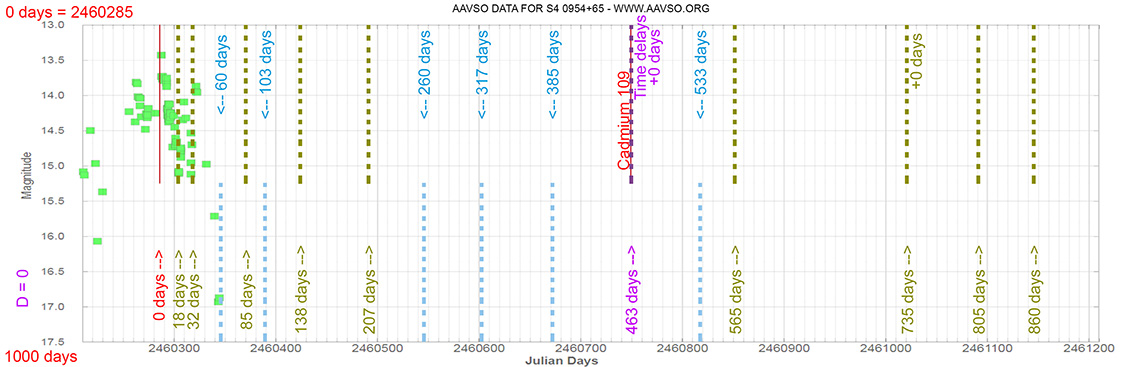
Blazar
S4 0954+65
(09 58 47.24510 +65 33 54.8181) z=0.367
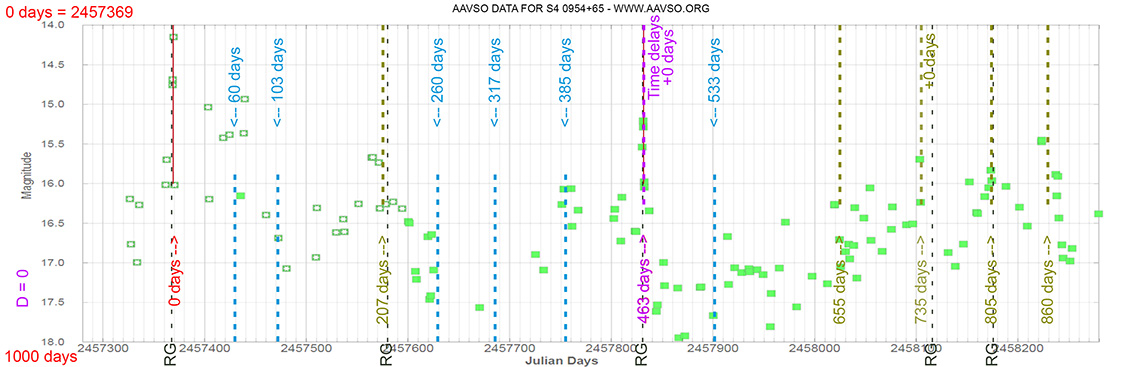
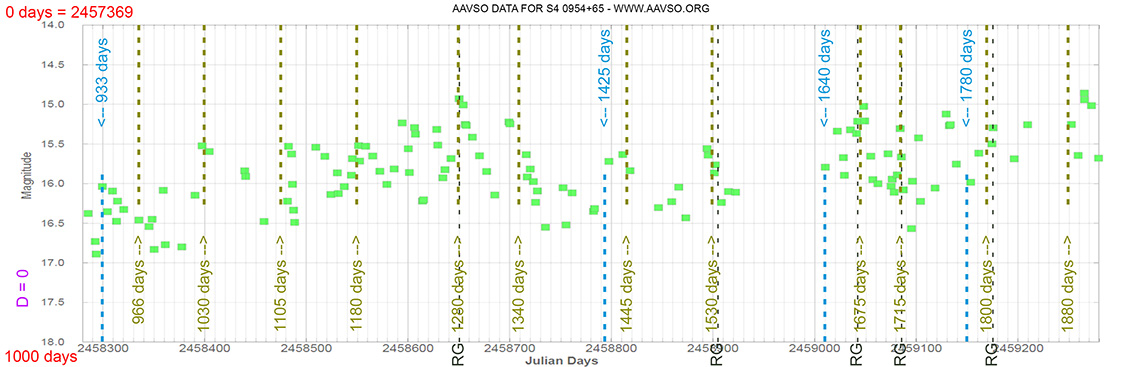
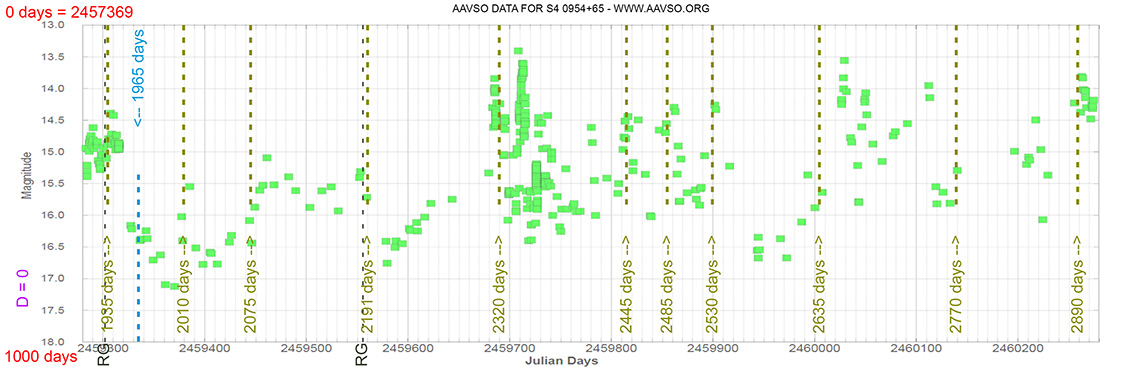
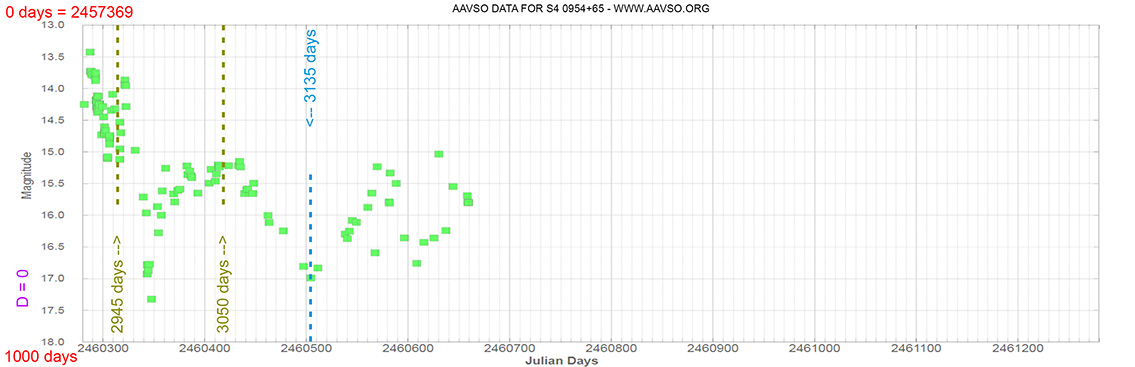
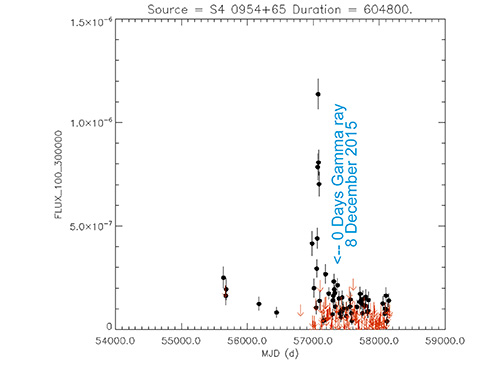
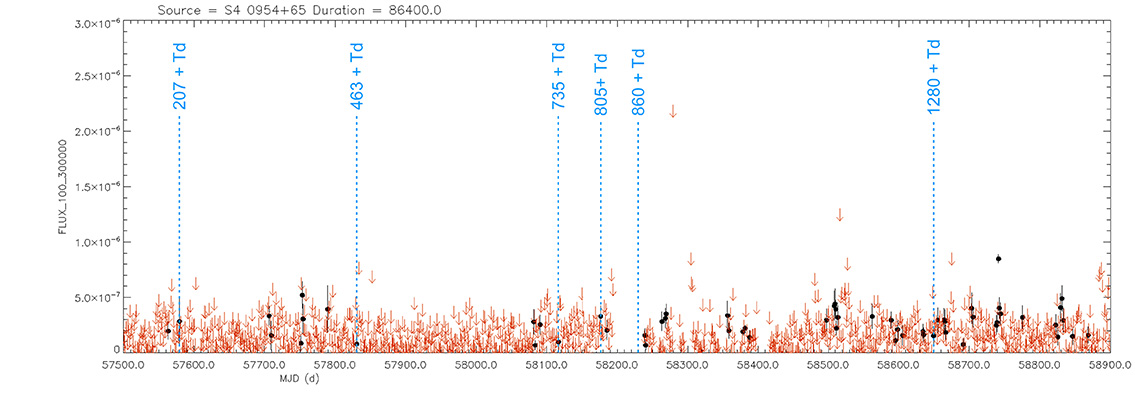
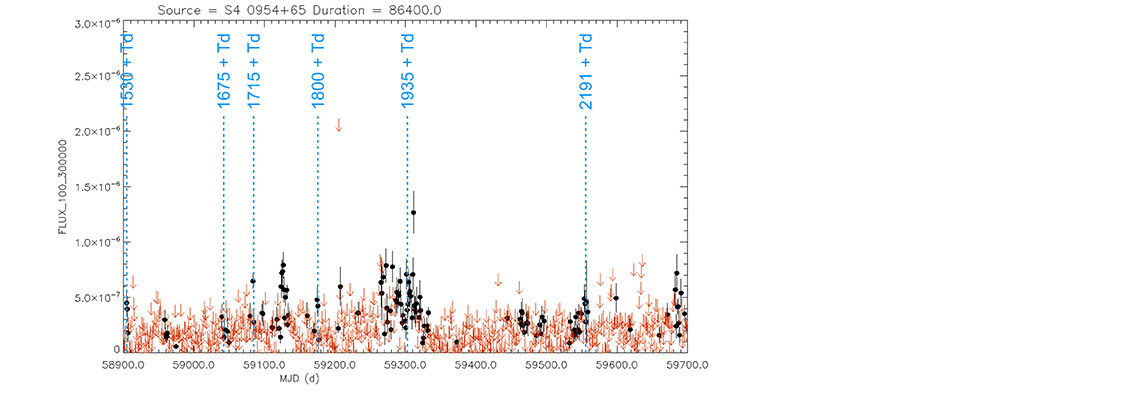
Light curve. NASA's Fermi Gamma-ray Space Telescope
Seyfert 1 Galaxy
S4 1030+61
(10 33 51.42726 +60 51 07.3301) z=1.40095
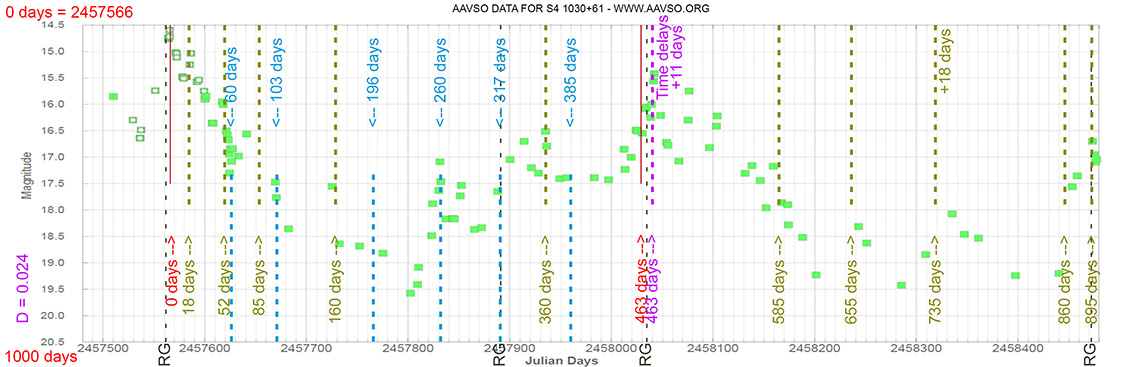
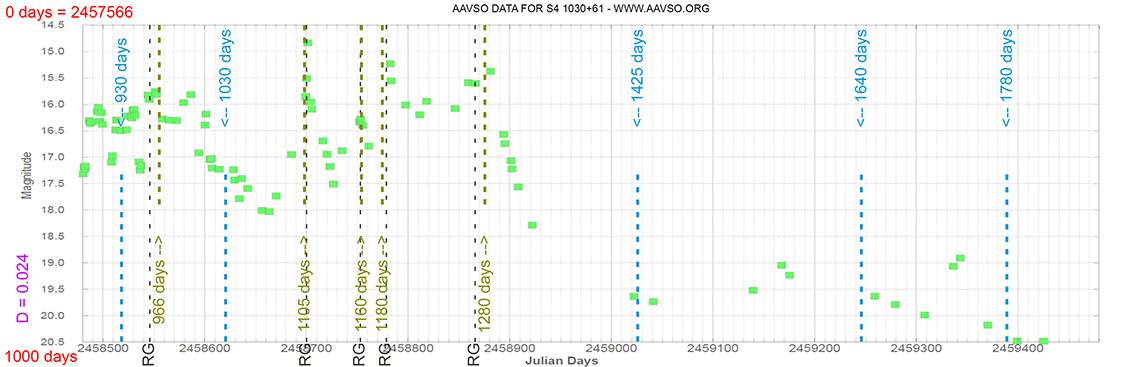
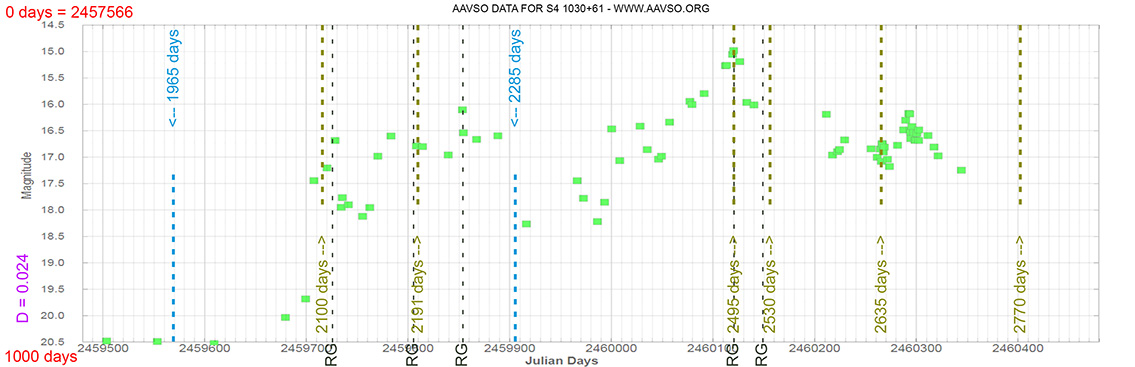
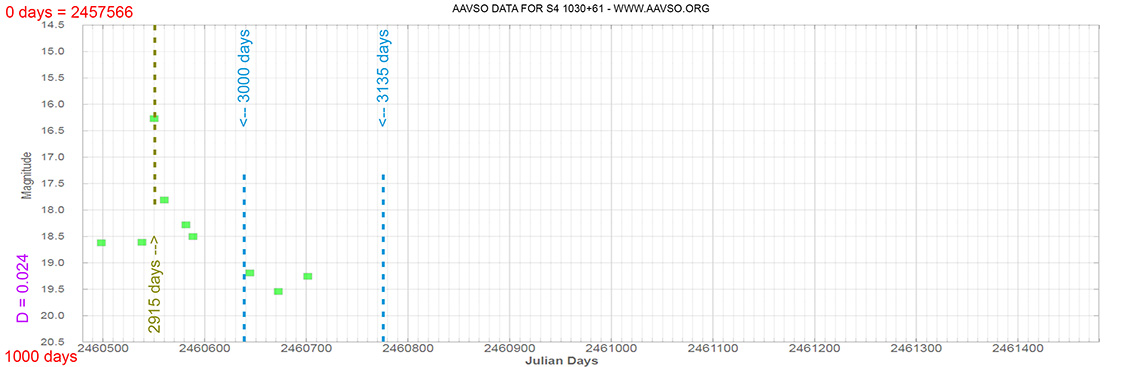
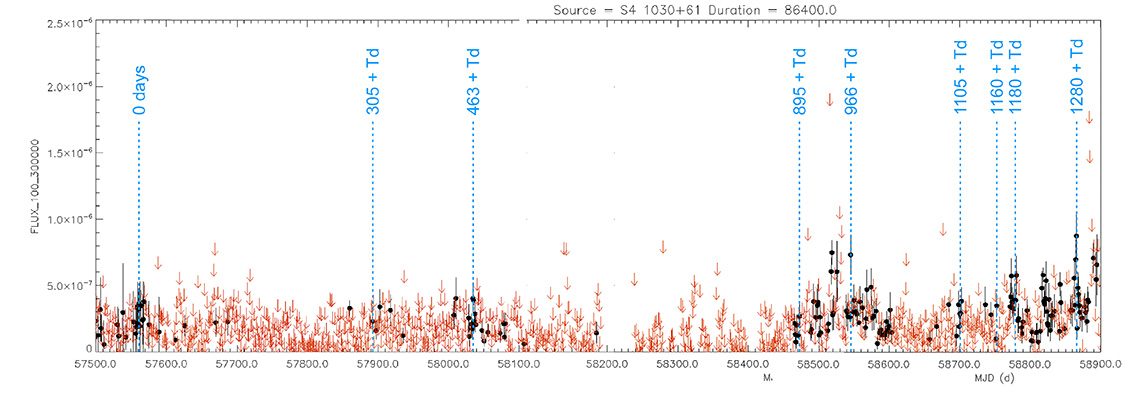
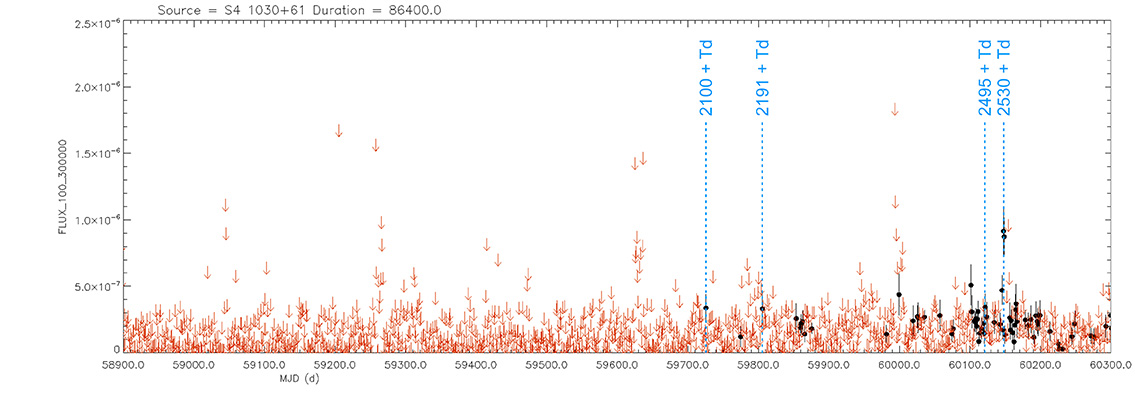
Light curve. NASA's Fermi Gamma-ray Space Telescope
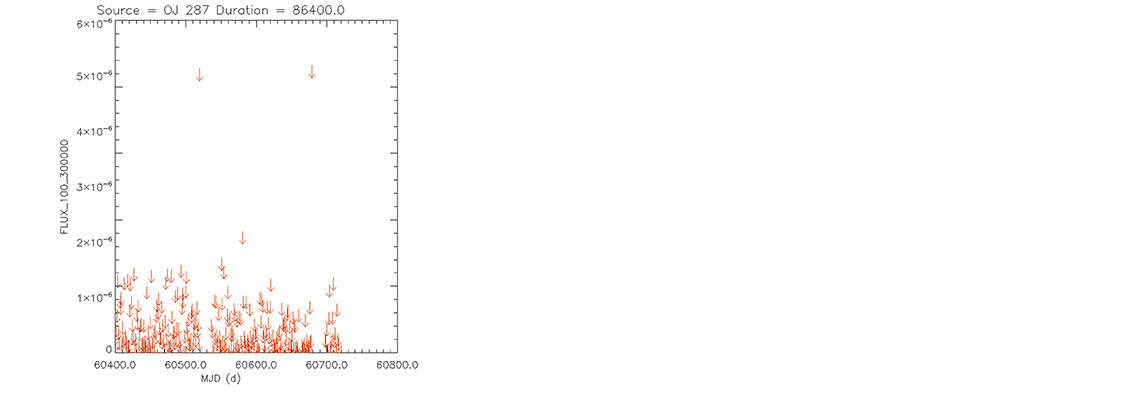
Blazar
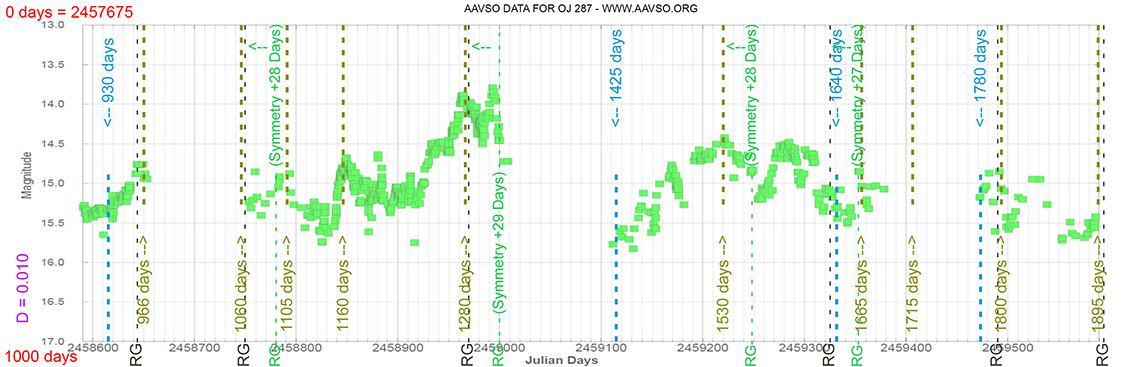
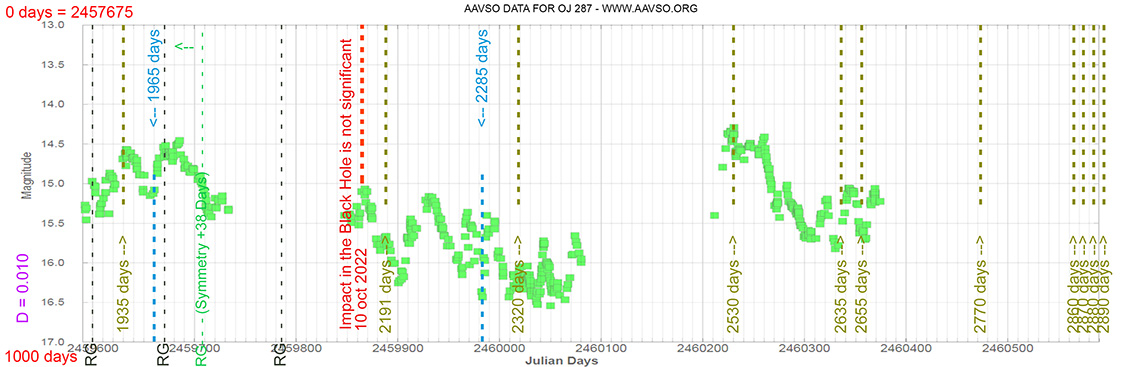
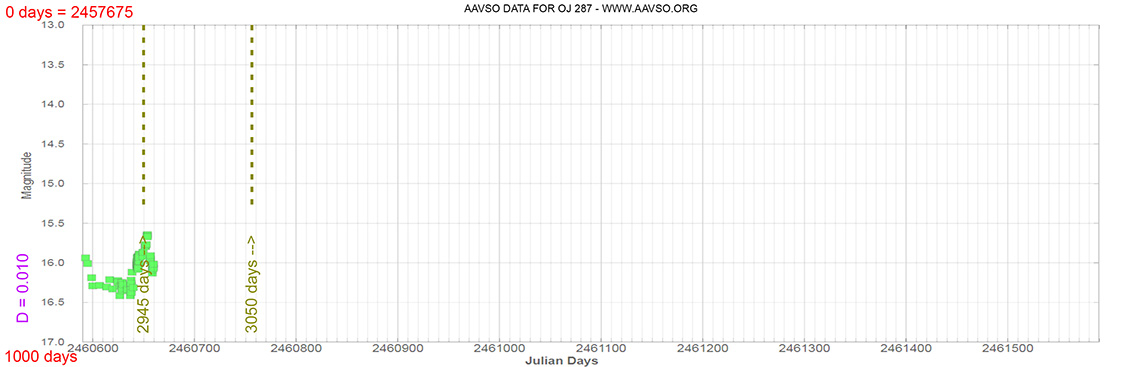
OJ 287
(08 54 48.87493 +20 06 30.6410) z=0.306
The Astronomer’s Telegram.
Nş 9489
Burst Gamma ray. 13 Sep 2016
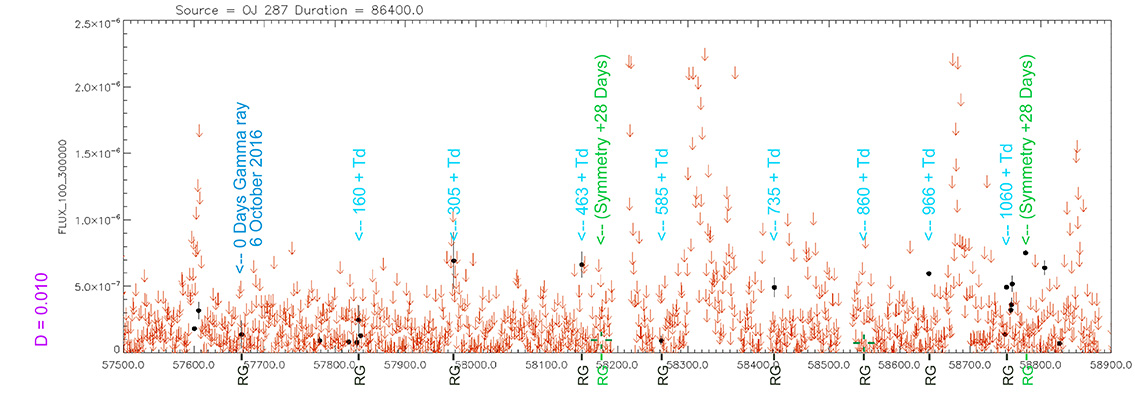
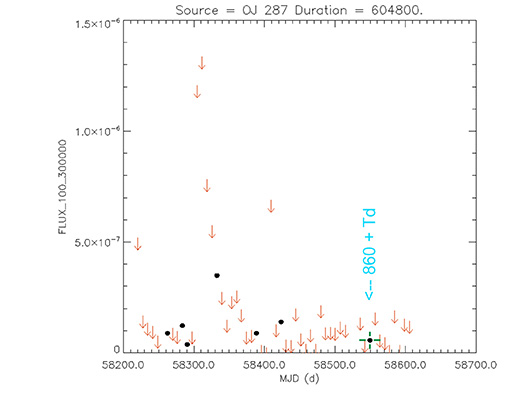
Light curve. NASA's Fermi Gamma-ray Space Telescope
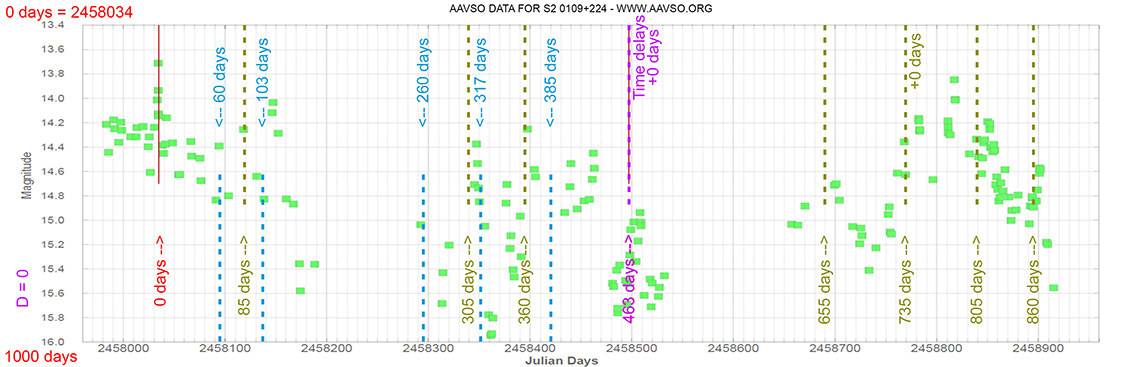
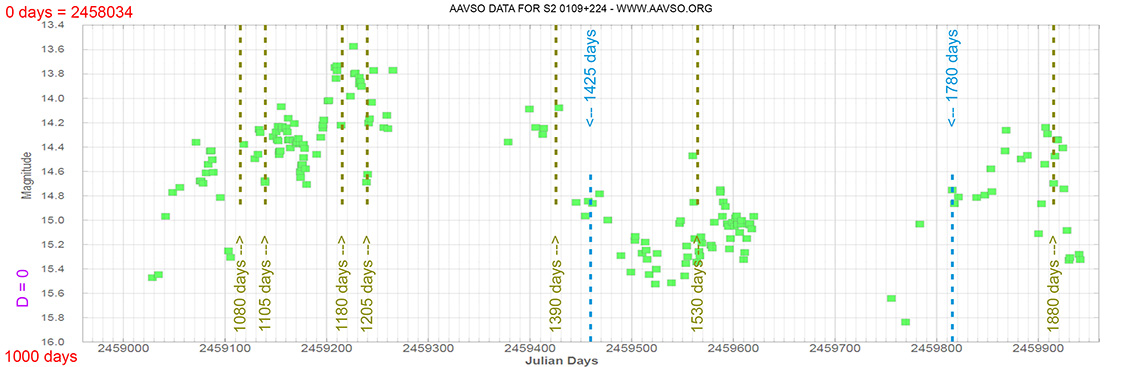
Blazar
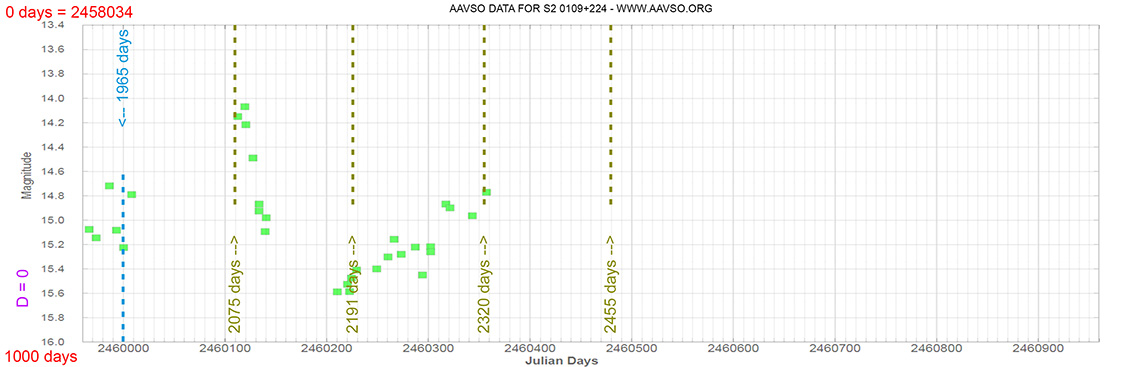
S2 0109+224
(01 12 05.82470 +22 44 38.7868) z=0.265
Blazar
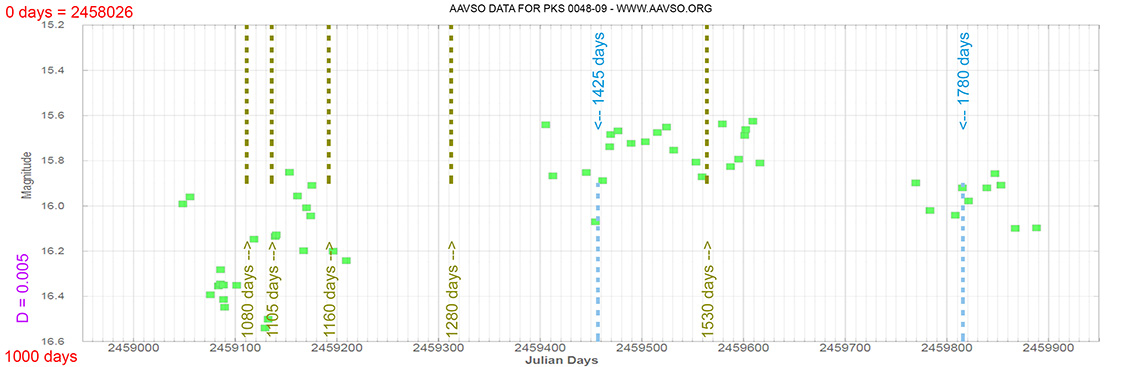
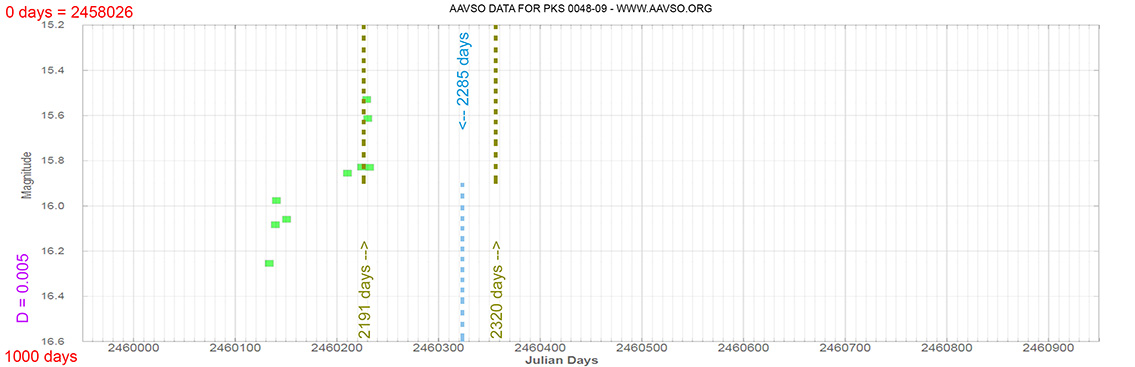
PKS 0048-09
(00 50 41.31738756 -09 29 05.2102688) z=0.635
Blazar
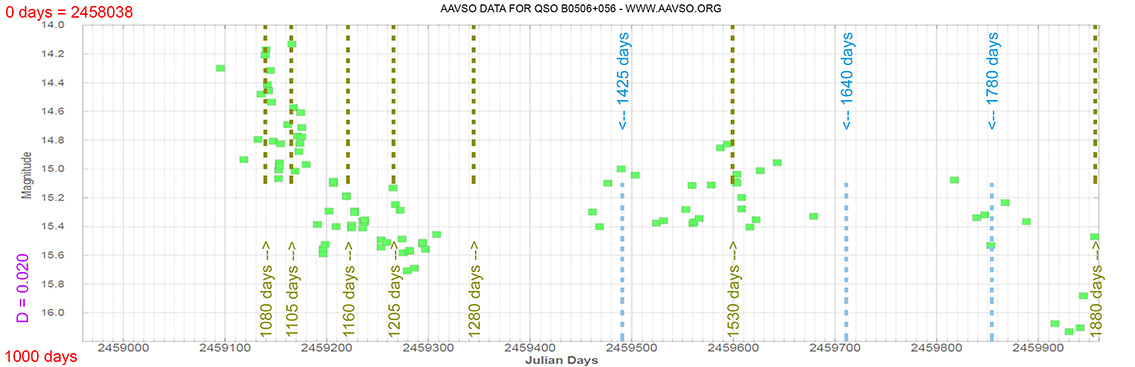
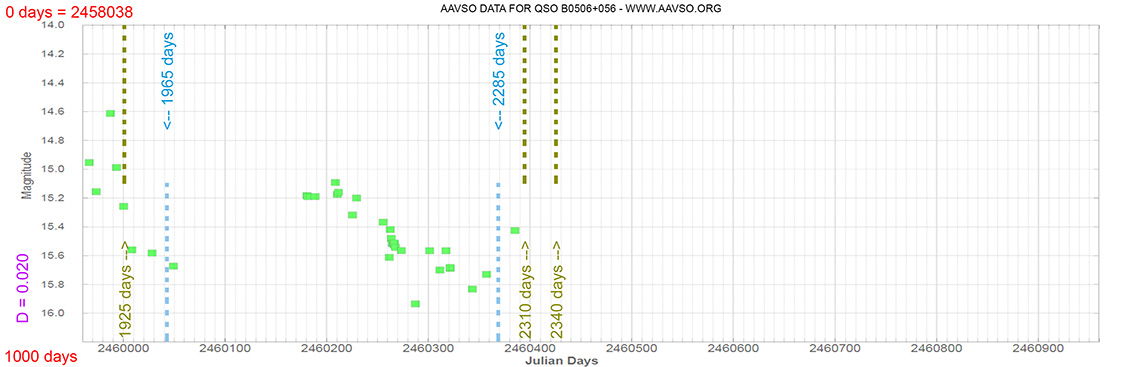
QSO B0506+056
(05 09 25.9645434784 +05 41 35.333636817) z=0.3365
Quasar
S4 1800+44
(18 01 32.31481 +44 04 21.9004) z=0.663
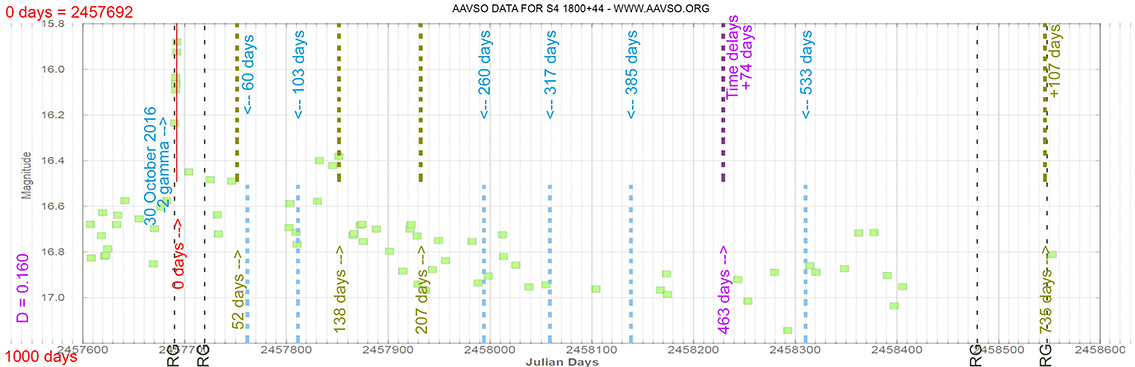
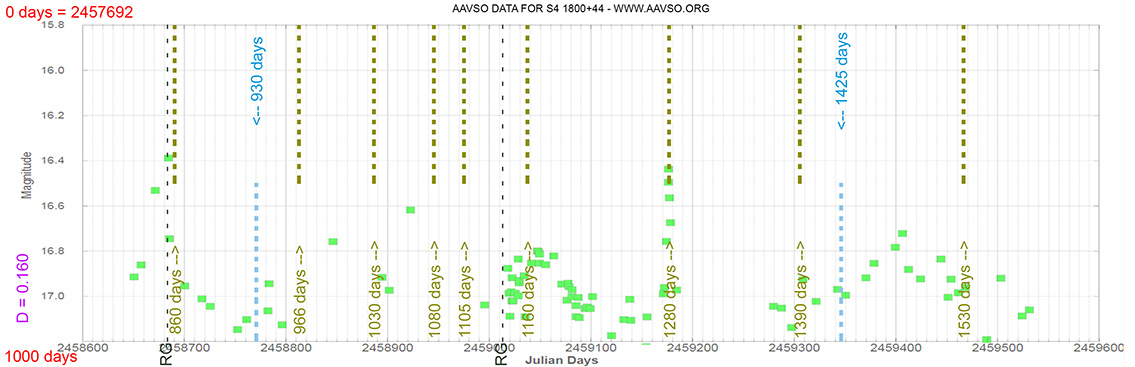
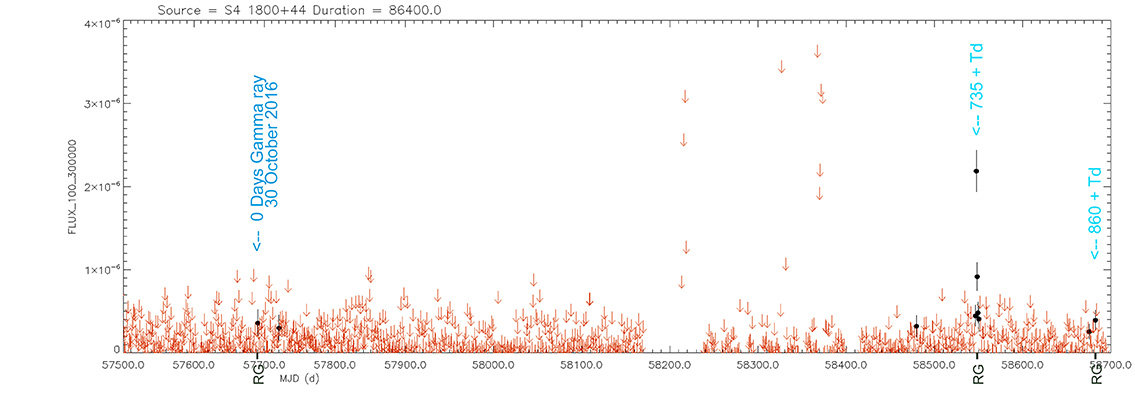
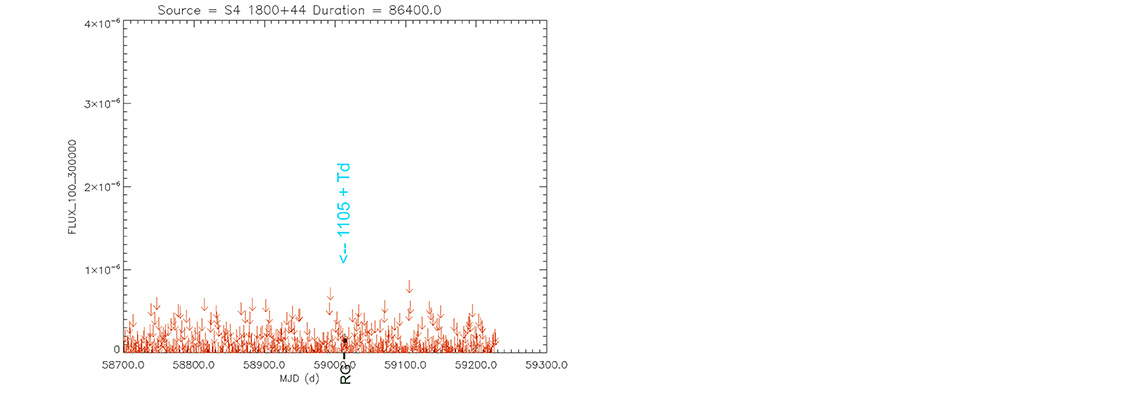
Light curve. NASA's Fermi Gamma-ray Space Telescope
Quasar
4C 29.45
(11 59 31.83390975 +29 14 43.8268741) z=0.72475
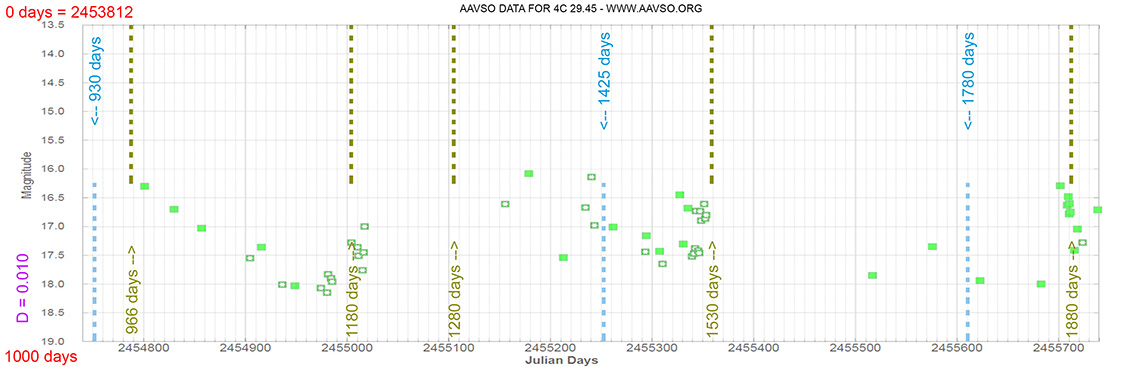
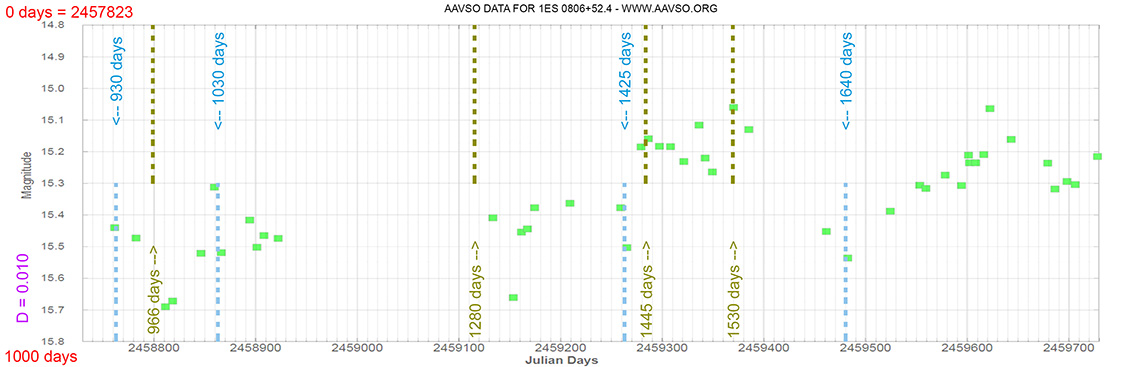
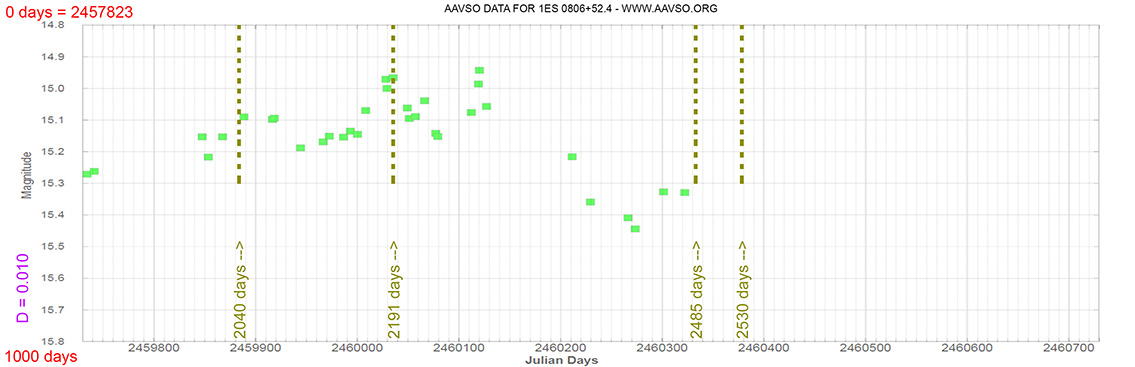
Quasar
1ES 0806+52.4
(08 09 49.18673 +52 18 58.2507) z=0.13710
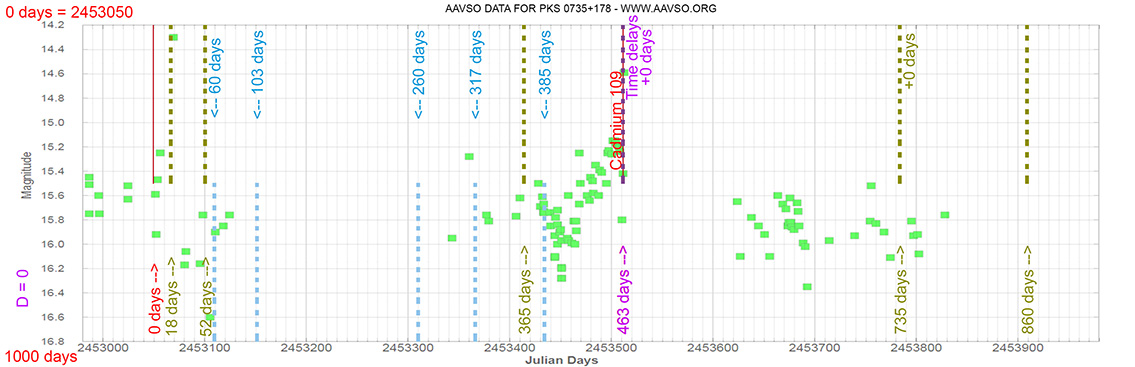
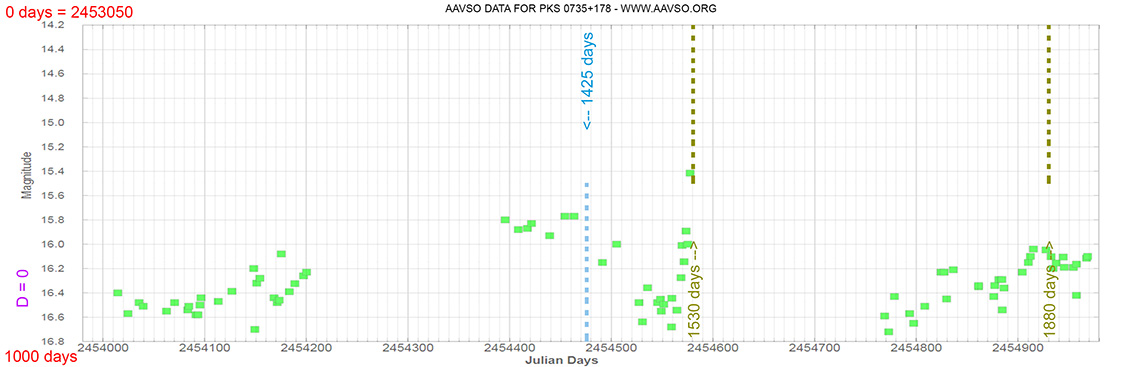
Blazar
PKS 0735+178
(07 38 07.39376 +17 42 18.9983) z=0.424
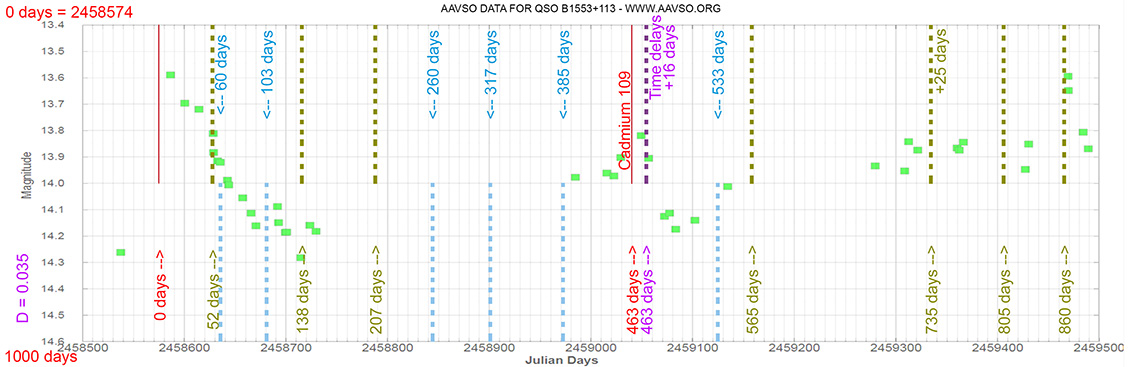
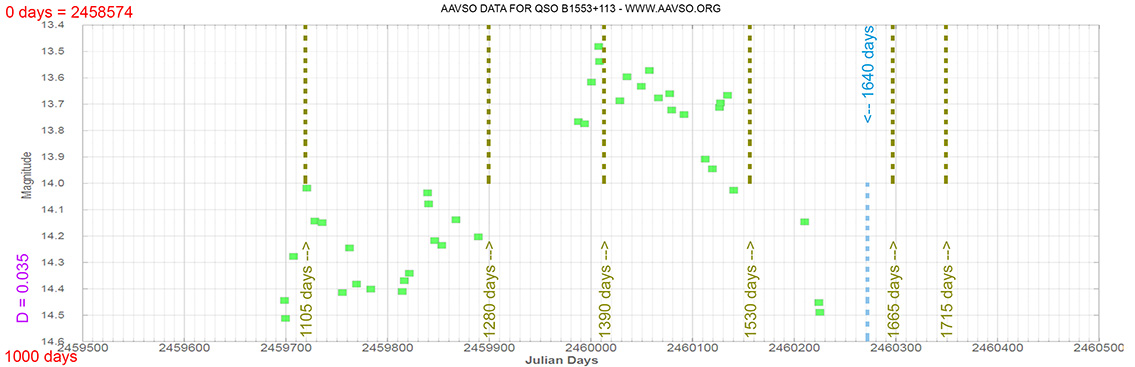
Blazar
QSO B1553+113
(15 55 43.0440 +11 11 24.366) z=0.360
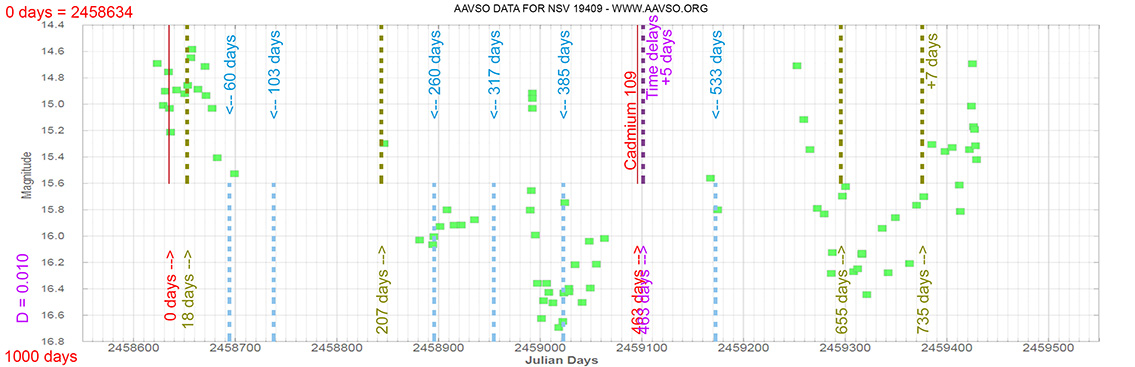
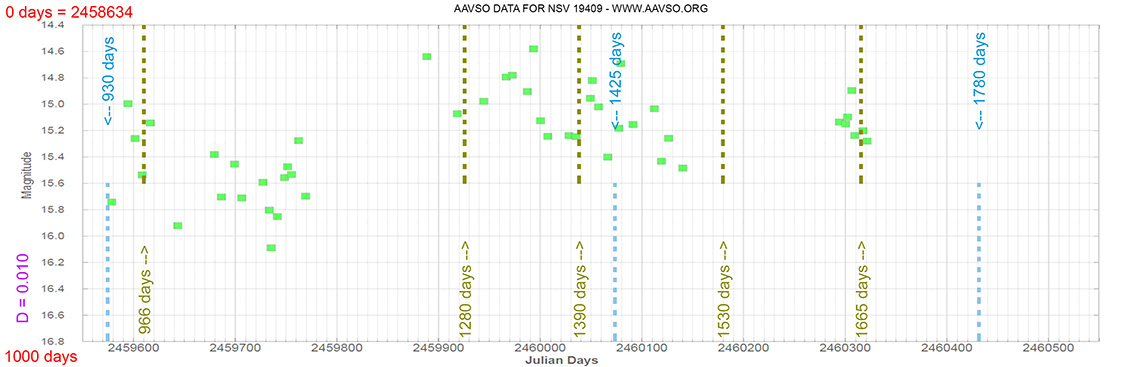
Blazar
NSV 19409
(12 30 14.0894 +25 18 07.136) z=0.135
Quasar
PKS 1510-089
(15 12 50.53292 -09 05 59.8296) z=0.360
Quasar
B2 1420+32
(14 22 30.37890 +32 23 10.4446) z=0.68144
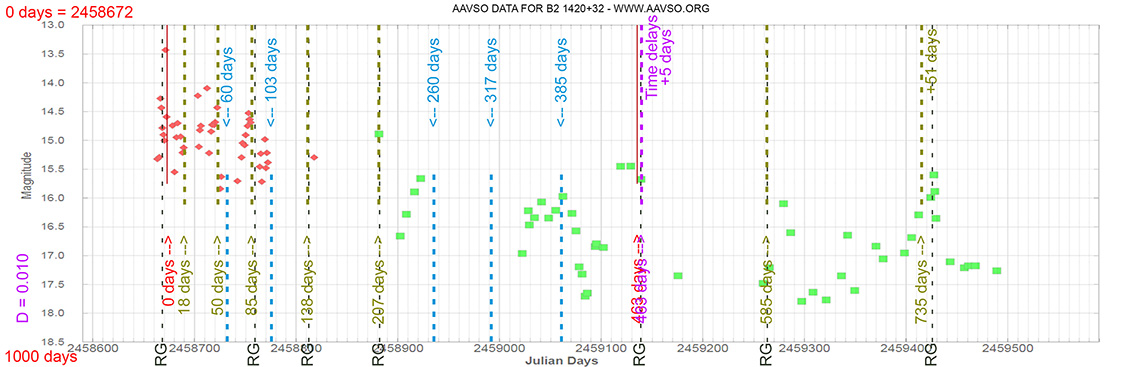
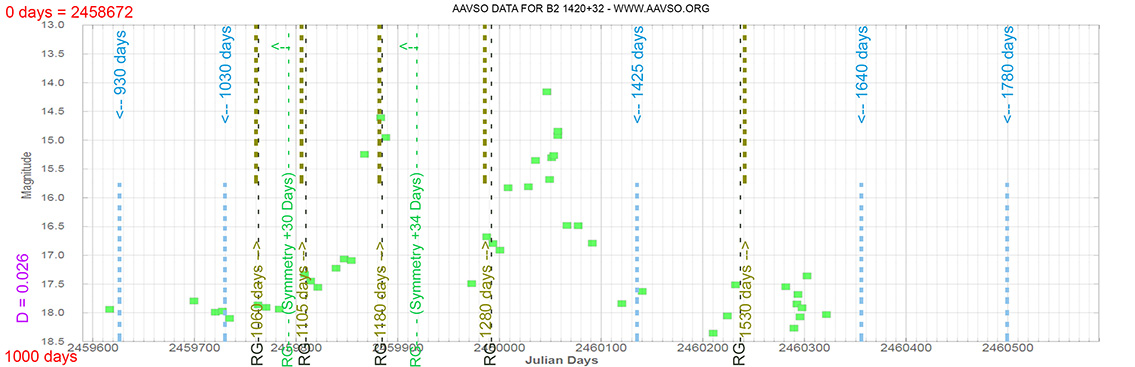
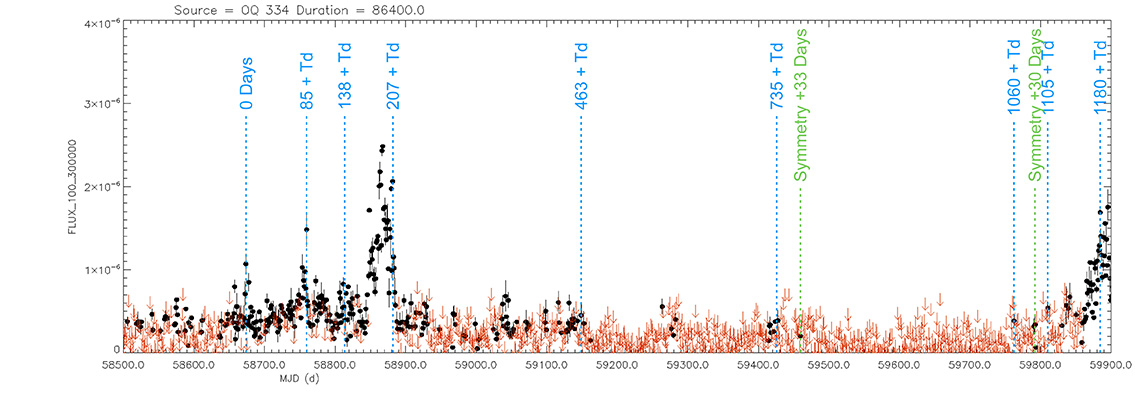
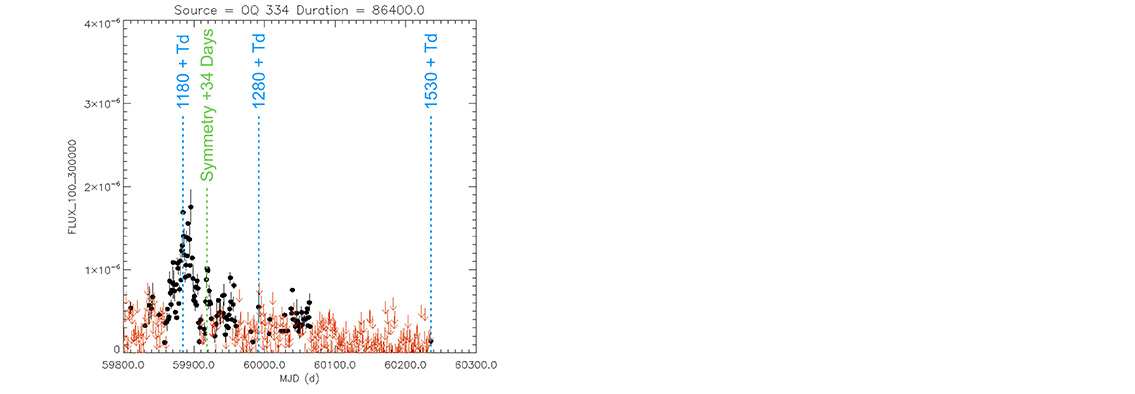
Light curve. NASA's Fermi Gamma-ray Space Telescope
Blazar
S5 1803+78
(18 00 45.684 +78 28 04.02) z=0.680
Blazar
BL LAC
(22 02 43.29139 +42 16 39.9803) z = 0.069
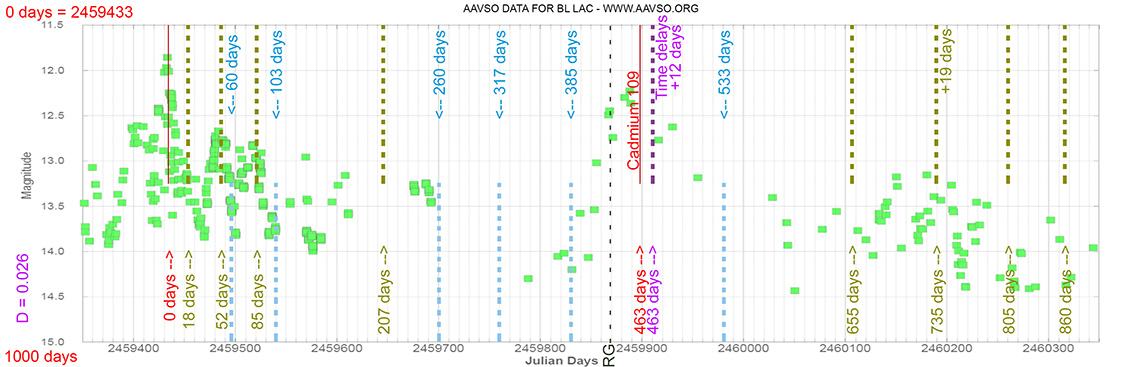
Blazar
S4 0954+65
(09 58 47.24510 +65 33 54.8181) z=0.367
Quasar
4C 29.45
(11 59 31.83390975 +29 14 43.8268741) z=0.72475
Blazar
S4 1749+70
(17 48 32.84043 +70 05 50.7684) z=0.770
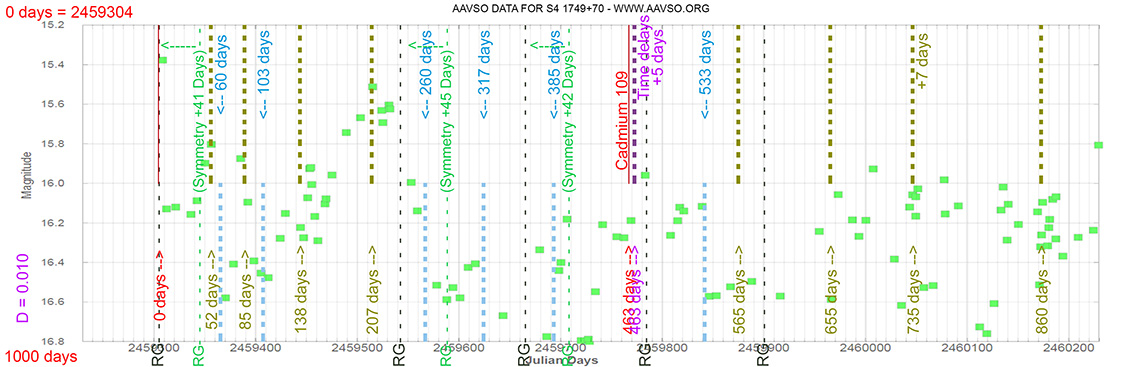
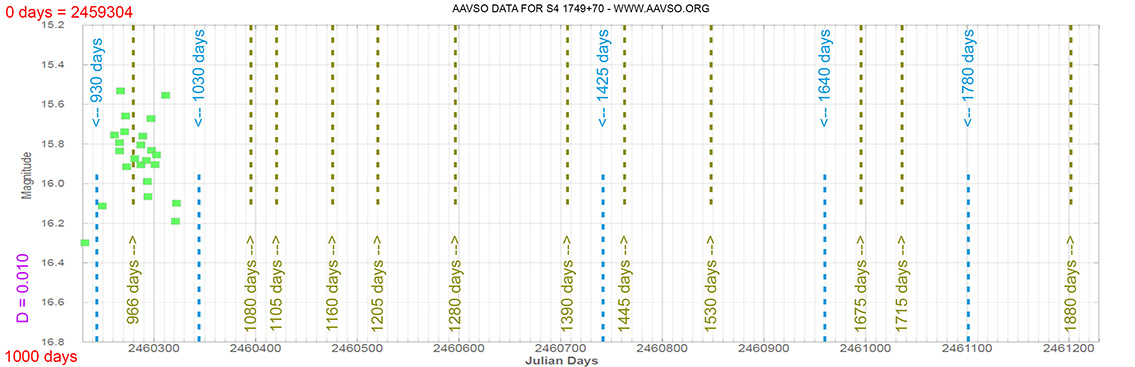
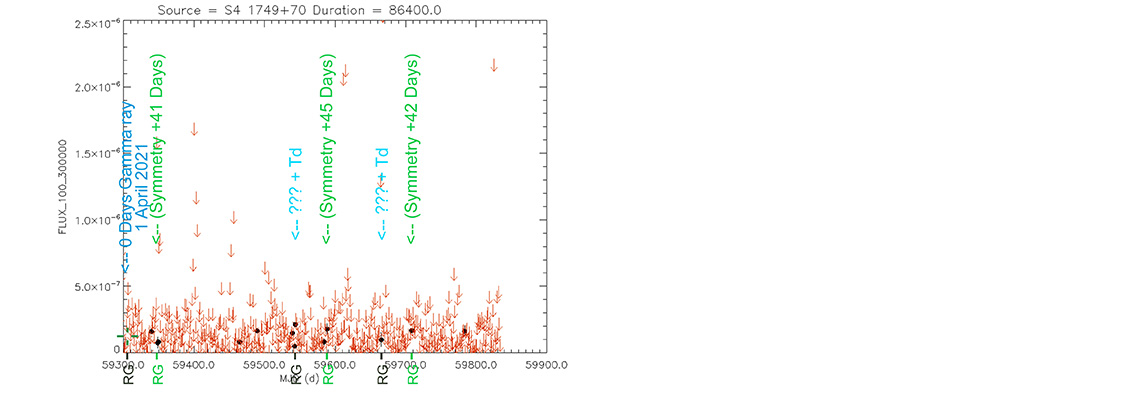
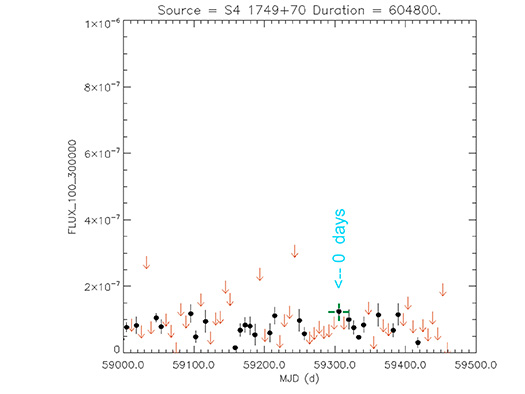
Light curve. NASA's Fermi Gamma-ray Space Telescope
Blazar
OT 355
(17 34 20.57853650 +38 57 51.4430945) z=0.975
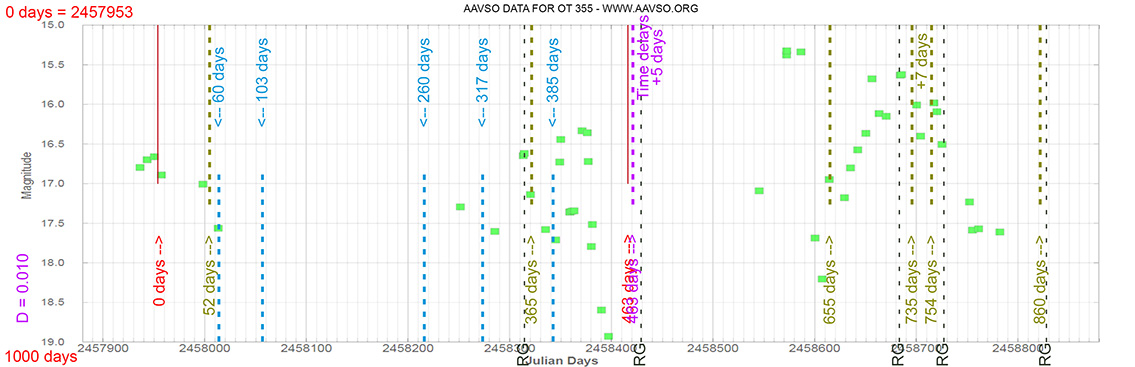
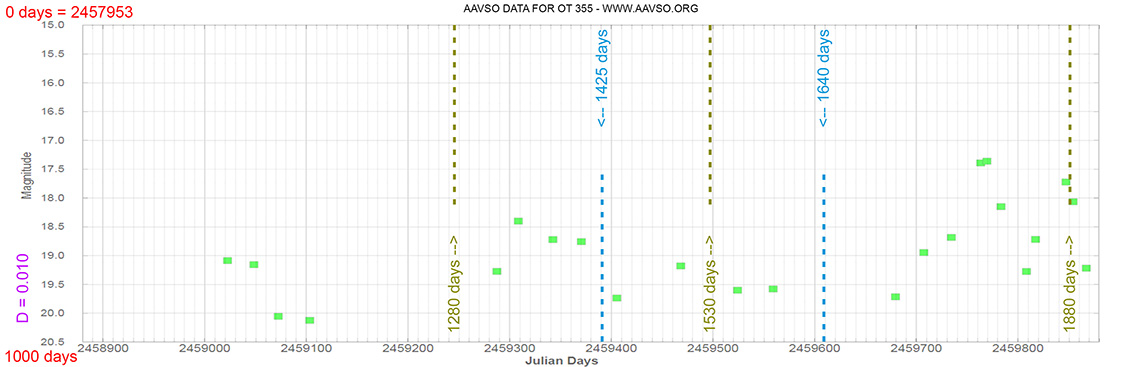
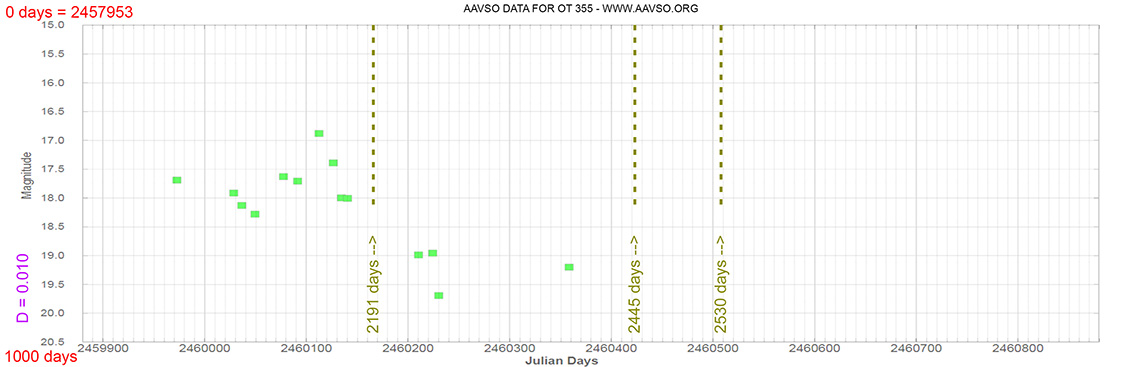
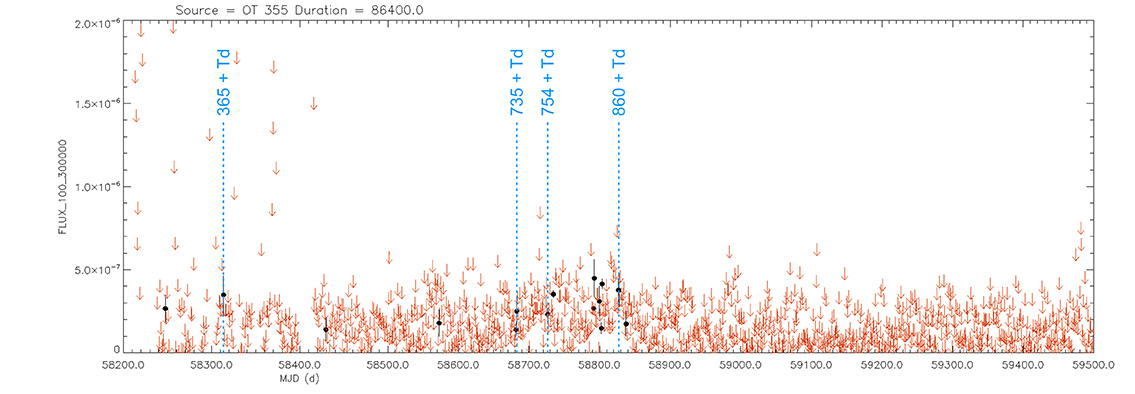
Light curve. NASA's Fermi Gamma-ray Space Telescope
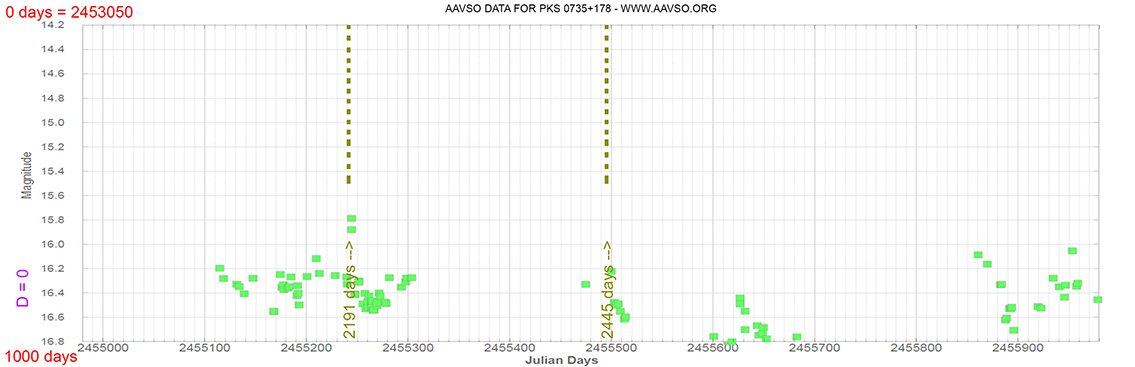
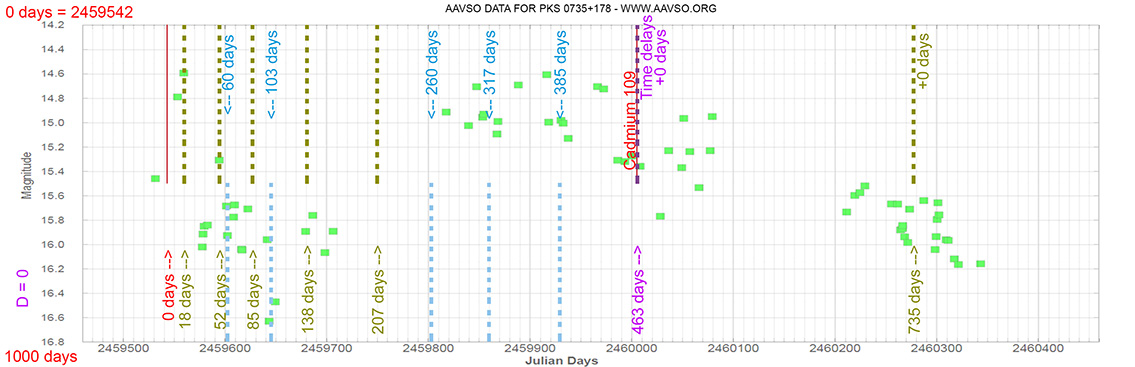
Blazar
PKS 0735+178
(07 38 07.39376 +17 42 18.9983) z=0.424
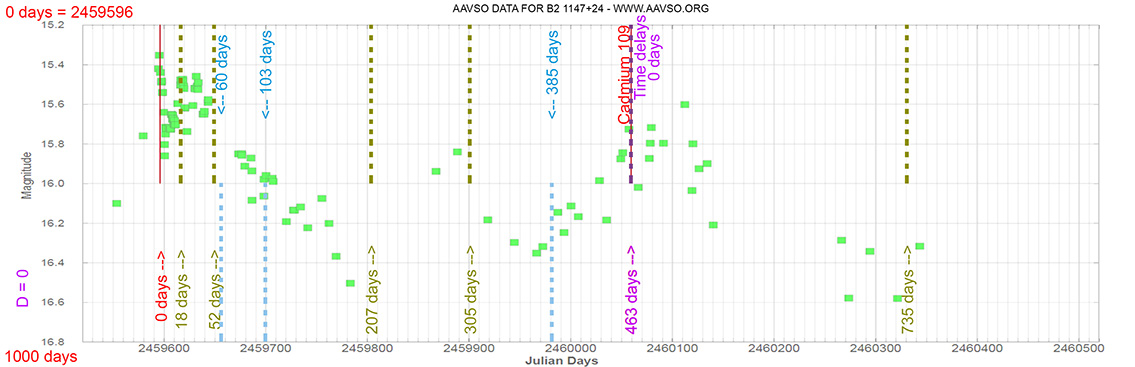
Blazar
B2 1147+24
(11 50 19.2122083392 +24 17 53.834712576) z=0.2090
Blazar
OJ 287
(11 50 19.2122083392 +24 17 53.834712576) z=0.2090
Blazar
AU CVN
(13 10 28.66385420 +32 20 43.7828340) z=0.99591
Blazar
4C 31.03
(01 12 50.3328920232 +32 08 17.435303556) z=0.600
-
Conclusions
- The Blazars have a temporary delay. This indicates that the observed light is very close to the event horizon of the black hole.
- They have a recognizable pattern. They are predictable.
- Secondary explosions correspond to radioactive decays and are in direct proportion to the intensity emitted. By comparing the intensity of these secondary explosions, we can know their amount of heavy elements.
- All AGNs have their maximum and minimum periods, equal. This confirms that all AGNs are the same objects, viewed from different perspectives.
- Although the maximum brightness at different wavelengths is related, there is a time delay of a few days with respect to other types of wavelengths detected, so that light emission does not occur exactly in the same place. Even in the main explosion, the maximum brightness in Gamma rays usually happens about 3 days earlier than in the optic.
- The higher the frequency detected, for example, in Gamma rays with respect to optics, the faster its brightness can change. This indicates that the gamma-ray emitting region is much smaller than in the optical region.
- By comparing the degree of time delay with other astrophysical magnitudes, we could discover related concepts.
- Depending on the Blazar, the main explosion as secondary explosions may be more acute or flattened, in the curves of light. We could know why the cone of the emitting Jet is narrower than others.
|
-
I thank the AAVSO for permission to publish their light curves and the M1 Group for their important contribution. Also to all observers who have made these observations, without them, this work would not have been possible. To all of them, thank you very much.
Especially my partner Diego Rodríguez from the M1 Group. Gianpiero Locatelli, Ramón Naves, David Cejudo, Jose Luis Martin, Jordi Berenguer and Fernando Huet Grondona from the Supernova Group. Also Dave Hinzel and Heinz-Bernd Eggenstein from the AAVSO. And to Daniel Mendicini from the LIADA Group.
Also the NASA Fermi Group to authorize publish their light curves in gamma rays for a greater understanding of these objects.
|